
Abstract
Aim Graves’ disease (GD) is an autoimmune disorder characterized by thyroid-specific autoimmunity and systemic inflammation. This study aimed to investigate changes in hematological inflammatory indices during follow-up in patients with GD and to evaluate their associations with thyroid function, thyroid autoantibodies, and disease activity, with particular emphasis on thyrotropin receptor antibody (TRAb) positivity. Methods This retrospective observational study included 161 adult patients with Graves’ disease who were followed at a tertiary referral center. Hematological inflammatory indices, including neutrophil-to-lymphocyte ratio (NLR), platelet-to-lymphocyte ratio (PLR), systemic immune-inflammation index (SII), neutrophil-to-platelet ratio (NPR), monocyte-to-high-density lipoprotein cholesterol ratio (MHR), and C-reactive protein-to-albumin ratio (CAR), were calculated using baseline laboratory data. Changes between diagnosis and follow-up were analyzed. Correlation analyses, receiver operating characteristic (ROC) curve analyses, and multivariable logistic regression models were performed to evaluate the relationships between inflammatory indices, thyroid function, thyroid autoantibodies, and antibody positivity. Results A total of 161 patients with Graves’ disease (mean age 41.9 ± 12.1 years; 81.4% female) were included. During follow-up, serum TSH increased significantly (0.06 ± 0.14 to 1.80 ± 4.94 mIU/L, P < .001), whereas FT3 decreased (6.36 ± 5.26 to 4.01 ± 1.66 pg/mL, P < .001). TRAb (8.11 ± 9.55 to 4.12 ± 5.63 IU/L), anti-TPO (376.16 ± 373.75 to 248.63 ± 287.41 IU/mL), and anti-Tg (172.80 ± 476.78 to 109.24 ± 258.35 IU/mL) levels all declined significantly (all p ≤ 0.003). Hematological inflammatory indices also decreased significantly, including NLR (2.38 ± 0.86 to 1.89 ± 0.63, P < .001), PLR (141.8 ± 38.6 to 129.5 ± 34.2, P = .003), SII (604 ± 221 to 487 ± 176, P < .001), NPR (0.0198 ± 0.0056 to 0.0162 ± 0.0048, P < .001), MHR (0.0127 ± 0.0041 to 0.0104 ± 0.0033, P < .001), and CAR (0.094 ± 0.036 to 0.066 ± 0.027, P < .001). Among the evaluated biomarkers, CAR demonstrated the best diagnostic performance for predicting persistent TRAb positivity at final follow-up (AUC 0.821, 95% CI 0.756–0.886), followed by NPR (adjusted OR = 1.69, 95% CI: 1.09–2.64, P = .025), MHR (AUC 0.782) and NPR (AUC 0.764). In multivariable logistic regression, CAR (adjusted OR 2.58, 95% CI 1.56–4.28, P < .001) and MHR (adjusted OR 2.03, 95% CI 1.26–3.28, P = .004) remained independent predictors of TRAb positivity. Conclusion Routine hematological inflammatory indices reflect systemic immune activation in Graves’ disease and improve following treatment. Among the evaluated biomarkers, CAR demonstrated the strongest and most consistent association with thyroid autoimmunity, while MHR also showed robust independent predictive value. These inexpensive and readily available biomarkers may complement conventional thyroid-specific tests for assessing autoimmune activity and disease severity, although prospective multicenter validation is required before routine clinical implementation.Keywords
Introduction
Graves' disease (GD) is the most common cause of autoimmune hyperthyroidism and is characterized by persistent stimulation of the thyroid gland by thyroid-stimulating hormone receptor antibodies (TRAb), resulting in excessive synthesis and secretion of thyroid hormones.1,2 Although the thyroid gland is the primary target organ, Graves' disease is increasingly recognized as a systemic autoimmune disorder involving complex interactions between innate and adaptive immune responses.3 Beyond thyrotoxicosis, the disease may affect multiple organs, most notably the orbit and skin, leading to Graves' orbitopathy and pretibial myxedema, respectively.4 Despite substantial advances in understanding its immunopathogenesis, the mechanisms determining the heterogeneous clinical manifestations and disease severity remain incompletely understood.
The immunopathogenesis of Graves' disease involves activation of autoreactive T lymphocytes, stimulation of B-cell-mediated autoantibody production, dysregulated cytokine signaling, and chronic systemic inflammation.5,6 Activated T-helper cells promote B-cell differentiation and TRAb production, while pro-inflammatory cytokines including interleukin-6 (IL-6), tumor necrosis factor-alpha (TNF-α), interferon-gamma (IFN-γ), and interleukin-17 (IL-17) amplify the inflammatory cascade and contribute to thyroid tissue remodeling and extra-thyroidal manifestations.4,7 These immune-mediated processes influence circulating leukocyte subsets, platelet activation, and endothelial function, thereby producing measurable alterations in peripheral blood cell counts that may reflect the systemic inflammatory burden of the disease.
Routine complete blood count (CBC)-derived inflammatory biomarkers have recently gained considerable attention because they provide inexpensive, readily available, and reproducible indicators of systemic inflammation. Among these, the neutrophil-to-lymphocyte ratio (NLR), platelet-to-lymphocyte ratio (PLR), and systemic immune-inflammation index (SII), calculated as platelet × neutrophil / lymphocyte, have emerged as promising markers reflecting the balance between innate immune activation, adaptive immune suppression, and platelet-mediated inflammatory responses.8-10 Elevated neutrophil counts generally indicate activation of the innate immune system, whereas relative lymphopenia reflects stress-induced redistribution or suppression of adaptive immunity. Increased platelet counts and activation further contribute to inflammatory signaling through interactions with leukocytes and endothelial cells.11,12 Consequently, these composite indices may provide a more comprehensive assessment of systemic inflammation than individual hematologic parameters alone.
Growing evidence suggests that hematological inflammatory indices are associated with disease activity and prognosis in a wide spectrum of autoimmune, endocrine, cardiovascular, and malignant disorders.8,11,13 In thyroid diseases, chronic autoimmune inflammation appears to influence leukocyte kinetics and platelet activation, making CBC-derived biomarkers attractive candidates for evaluating inflammatory status. Previous studies have demonstrated significantly higher NLR and PLR values in patients with Graves' disease compared with healthy controls and reported correlations with thyroid hormone concentrations, TRAb levels, and the presence of Graves' orbitopathy.14-17 Furthermore, SII has recently emerged as a comprehensive inflammatory biomarker integrating neutrophil, lymphocyte, and platelet counts, and has shown promising diagnostic and prognostic performance in several inflammatory and autoimmune diseases.10,11 Nevertheless, evidence regarding its clinical utility in Graves' disease remains limited.
Disease activity assessment in Graves' disease currently relies primarily on biochemical thyroid function tests, including serum thyroid-stimulating hormone (TSH), free thyroxine (FT4), free triiodothyronine (FT3), and TRAb concentrations.2,18 Although these biomarkers accurately reflect thyroid function and autoimmune activity, they do not fully characterize the systemic inflammatory response accompanying the disease. Moreover, laboratory assays such as TRAb measurements may not be universally available, particularly in resource-limited settings. Therefore, identifying inexpensive and universally accessible inflammatory biomarkers capable of complementing conventional thyroid-specific parameters may improve risk stratification, facilitate longitudinal monitoring, and potentially aid in identifying patients at increased risk of extra-thyroidal involvement.
Given the central role of immune dysregulation and systemic inflammation in the pathophysiology of Graves' disease, comprehensive evaluation of CBC-derived inflammatory biomarkers may provide additional insights into disease activity beyond conventional thyroid function tests. Such biomarkers could represent practical, low-cost tools for monitoring inflammatory burden and supporting clinical decision-making in everyday endocrinology practice.
Therefore, the present study aimed to investigate hematological inflammatory parameters, including NLR, PLR, and SII, in patients with Graves' disease and to evaluate their associations with thyroid hormone levels, disease activity, and clinical characteristics. We hypothesized that these readily obtainable inflammatory indices reflect systemic immune activation and may serve as complementary biomarkers for assessing disease severity and clinical manifestations in Graves' disease.
Materials and Methods
Study Design and Ethical Approval This retrospective observational study was conducted at the Department of Endocrinology and Metabolic Diseases, Gaziantep City Hospital, Türkiye. Study Population Patients aged 18 years or older who were diagnosed with Graves' disease and followed at the outpatient Endocrinology Clinic of Gaziantep City Hospital between November 2023 and July 2026 were retrospectively screened for eligibility. The diagnosis of Graves' disease was established according to the American Thyroid Association (ATA) Guidelines based on the presence of biochemical hyperthyroidism, suppressed serum thyroid-stimulating hormone (TSH), elevated free thyroxine (FT4) and/or free triiodothyronine (FT3) concentrations, positive TSH receptor antibody (TRAb) levels, and compatible clinical findings.1,2 Patients were eligible for inclusion if they were aged 18 years or older, had a confirmed diagnosis of Graves' disease based on established clinical and biochemical criteria, and had complete clinical records, including complete blood count (CBC), thyroid function tests, and TSH receptor antibody (TRAb) measurements available both at the time of diagnosis and at the final follow-up visit. Patients were excluded if they had evidence of active infection at the time of blood sampling, hematological disorders, current or previous malignancy, chronic inflammatory or autoimmune diseases other than Graves' disease, chronic liver failure, end-stage renal disease, pregnancy, or incomplete clinical or laboratory data that could affect the assessment of hematological inflammatory parameters. Data Collection Clinical and laboratory data were retrospectively extracted from the electronic medical records and the hospital information management system by the investigators using a standardized data collection form. Demographic characteristics, including age, sex, and smoking status, were recorded. Clinical variables included the date of diagnosis, duration of follow-up, treatment modality (antithyroid drugs, radioactive iodine therapy, or thyroidectomy), and the presence of Graves' orbitopathy. Laboratory parameters obtained both at the time of diagnosis and at the final follow-up visit included serum thyroid-stimulating hormone (TSH), free thyroxine (FT4), free triiodothyronine (FT3), TSH receptor antibody (TRAb), and complete blood count (CBC) parameters, including neutrophil, lymphocyte, and platelet counts. All laboratory analyses were performed in the central laboratory of Gaziantep City Hospital using standardized automated analyzers in accordance with the manufacturer's instructions and routine internal and external quality-control procedures. Only anonymized data were analyzed, and all patient identifiers were removed before statistical evaluation to ensure data confidentiality. Serum TRAb concentrations were measured using a third-generation competitive electrochemiluminescence immunoassay (Elecsys Anti-TSHR, Roche Diagnostics GmbH, Mannheim, Germany) on a cobas e immunoassay analyzer. The analytical measuring range was 0.8–40 IU/L. According to the manufacturer’s recommended reference threshold, values ≤1.75 IU/L were considered negative, whereas values >1.75 IU/L were classified as positive. Hematological Inflammatory Indices The neutrophil-to-lymphocyte ratio (NLR) was calculated as the absolute neutrophil count divided by the absolute lymphocyte count. The platelet-to-lymphocyte ratio (PLR) was calculated as the platelet count divided by the absolute lymphocyte count. The systemic immune-inflammation index (SII) was calculated as platelet count × neutrophil count / lymphocyte count. The neutrophil-to-platelet ratio (NPR) was calculated as the absolute neutrophil count divided by the platelet count. The monocyte-to-high-density lipoprotein cholesterol ratio (MHR) was calculated as the absolute monocyte count divided by the serum high-density lipoprotein (HDL) cholesterol concentration. The C-reactive protein-to-albumin ratio (CAR) was calculated as serum C-reactive protein (CRP) divided by serum albumin concentration. All indices were calculated using baseline laboratory measurements obtained at the time of diagnosis. Follow-up and Treatment Protocol Follow-up duration was defined as the interval between the baseline assessment at diagnosis and the final visit at which paired clinical and laboratory measurements were available. The median follow-up duration was 18 months (IQR, 12–24 months; range, 6–32 months). Among the 148 patients who received antithyroid drug therapy, the median treatment duration was 16 months (IQR, 10–22 months; range, 4–30 months). Treatment decisions were made by the attending endocrinologist as part of routine clinical care according to the biochemical severity of hyperthyroidism, clinical findings, treatment response, and drug tolerability. Methimazole was the preferred first-line treatment and was administered to 141 patients (87.6%). The initial methimazole dose ranged from 5 to 30 mg/day and was subsequently titrated according to serum FT3 and FT4 concentrations; after biochemical control was achieved, maintenance doses generally ranged from 2.5 to 10 mg/day. Propylthiouracil was administered to seven patients (4.3%) in whom methimazole was contraindicated or not tolerated, at an initial dose of 100–300 mg/day in two or three divided doses. Thyroid function tests were generally reassessed 4–6 weeks after treatment initiation or a dose adjustment and every 8–12 weeks after biochemical stabilization. At the final assessment, 10 patients (6.2%) were not receiving antithyroid medication: seven were in biochemical remission, two had previously undergone radioactive iodine therapy, and one had undergone thyroidectomy. Three patients (1.9%) with mild symptoms were receiving symptomatic beta-blocker therapy alone (propranolol, 20–40 mg/day). Overall, four patients (2.5%) had a history of radioactive iodine therapy, and one patient (0.6%) had undergone thyroidectomy. Because this was a retrospective observational study, treatment was not assigned according to a study-specific protocol. Study Outcomes The primary outcome of this study was to evaluate the association between complete blood count (CBC)-derived inflammatory indices, including the neutrophil-to-lymphocyte ratio (NLR), platelet-to-lymphocyte ratio (PLR), systemic immune-inflammation index (SII), neutrophil-to-platelet ratio (NPR), monocyte-to-high-density lipoprotein cholesterol ratio (MHR), and C-reactive protein-to-albumin ratio (CAR), and disease activity in patients with Graves' disease. Disease activity was assessed using thyroid function parameters (serum TSH, free triiodothyronine [FT3], and free thyroxine [FT4]) together with thyroid autoimmunity markers, including thyrotropin receptor antibody (TRAb). The secondary outcomes were to investigate the relationships between hematological inflammatory indices and thyroid autoimmunity, Graves' orbitopathy, treatment modality, and other clinical characteristics. Correlation analyses were performed to evaluate the associations between inflammatory indices and thyroid function, inflammatory markers, and thyroid autoantibody levels. Receiver operating characteristic (ROC) curve analyses were performed to assess the diagnostic performance of baseline inflammatory indices for predicting persistent TRAb positivity at final follow-up. Ethical Approval The study protocol was reviewed and approved by the Gaziantep City Hospital Non-Interventional Clinical Research Ethics Committee (Approval No. 579/2026; Approval Date: 06 June 2026). Because of the retrospective nature of the study and the use of anonymized clinical data, the requirement for written informed consent was waived by the Ethics Committee. All study procedures were conducted in accordance with the ethical principles of the Declaration of Helsinki and its subsequent amendments. Statistical Analysis All statistical analyses were performed using IBM SPSS Statistics version 27.0 (IBM Corp., Armonk, NY, USA) and R software (version 4.3.0; R Foundation for Statistical Computing, Vienna, Austria). Continuous variables were assessed for normality using visual inspection of histograms and Q–Q plots together with the Shapiro–Wilk test. Normally distributed variables are presented as mean ± standard deviation (SD), whereas non-normally distributed variables are expressed as median and interquartile range (IQR). Categorical variables are presented as frequencies and percentages. Comparisons between baseline and final follow-up measurements were performed using the paired-samples t-test for normally distributed variables and the Wilcoxon signed-rank test for non-normally distributed variables. Categorical variables were compared using the chi-square test or Fisher's exact test, as appropriate. Correlations between hematological inflammatory indices and clinical or laboratory parameters were evaluated using Spearman's rank correlation coefficient (ρ). To reduce the risk of false-positive findings resulting from multiple comparisons, p values obtained from the correlation analyses were adjusted using the Benjamini–Hochberg false discovery rate (FDR) procedure. Receiver operating characteristic (ROC) curve analyses were performed to evaluate the diagnostic performance of baseline hematological inflammatory indices for predicting thyrotropin receptor antibody (TRAb) positivity. The area under the receiver operating characteristic curve (AUC) and corresponding 95% confidence intervals (CIs) were calculated for each inflammatory index. Optimal cut-off values were determined using the maximum Youden index. Sensitivity, specificity, positive predictive value (PPV), and negative predictive value (NPV) were calculated for the optimal cut-off values. Pairwise comparisons of ROC curves were performed using the DeLong method. Multivariable logistic regression analysis was performed to identify baseline factors independently associated with persistent TRAb positivity at the final follow-up visit. TRAb status at final follow-up was coded as a binary dependent variable (positive vs. negative according to the prespecified assay cut-off). Age and sex were retained in the model a priori because of their established clinical relevance. Each baseline hematological inflammatory index was initially evaluated in a univariable logistic regression analysis, and indices associated with the outcome at P < .10 were considered candidate predictors for the multivariable model. Before model construction, pairwise correlations and variance inflation factors (VIFs) were examined to assess multicollinearity among the candidate predictors. A VIF ≥5 was considered indicative of potentially important multicollinearity. When substantial collinearity was identified, the variable with the stronger clinical rationale and greater univariable discriminatory performance was preferentially retained. Eligible predictors were entered simultaneously using the forced-entry method; no automated stepwise selection procedure was used. Model complexity was restricted to maintain at least 10 outcome events per estimated predictor. Model calibration was assessed using the Hosmer–Lemeshow goodness-of-fit test, and discrimination was evaluated using the area under the ROC curve. Adjusted odds ratios (ORs) with 95% confidence intervals (CIs) were reported. All statistical tests were two-sided, and a p value <0.05 was considered statistically significant. Reporting Guidelines The study was designed in accordance with the Strengthening the Reporting of Observational Studies in Epidemiology (STROBE) statement for observational studies.Results
Study flow diagram of patient selection and study population are shown in Figure 1. A total of 184 electronic medical records were screened, and all patients were assessed for eligibility. Twenty-three patients were excluded because of incomplete paired clinical or laboratory data (n = 9), active infection (n = 5), other chronic inflammatory or autoimmune diseases (n = 4), malignancy or hematological disorders (n = 3), or pregnancy or severe hepatic/renal disease (n = 2). The final study cohort consisted of 161 eligible patients who underwent baseline demographic, clinical, laboratory, and hematological inflammatory index assessments (Figure 1). Baseline demographic and clinical characteristics of patients with Graves' disease are shown in Table 1. The mean age was 41.9 ± 12.1 years, and 131 patients (81.4%) were female. Thirty-seven patients (23.0%) were current smokers, whereas 124 (77.0%) were non-smokers. Regarding disease status, 144 patients (89.4%) had established Graves' disease during follow-up, 9 (5.6%) were newly diagnosed, 7 (4.3%) were in remission, and 1 (0.6%) had recurrent disease. A positive family history was present in 16 patients (9.9%), and comorbidities were reported in 17 (10.6%). Methimazole was the most frequently prescribed antithyroid medication (87.6%), followed by propylthiouracil (4.3%), while 6.2% of patients were not receiving antithyroid therapy. Previous radioactive iodine treatment and thyroidectomy were reported in 2.5% and 0.6% of patients, respectively. Thyroid ultrasonography data were available for 160 patients (99.4%) (Table 1). Changes in thyroid function tests and routine laboratory parameters between diagnosis and final follow-up are shown in Table 2. Serum TSH levels increased significantly from 0.02 (IQR, 0.01–0.06) mIU/L at diagnosis to 0.62 (IQR, 0.23–1.65) mIU/L at final follow-up (P < .001), whereas FT3 levels decreased from 4.90 (IQR, 3.01–7.98) to 3.70 (IQR, 2.83–4.84) pg/mL (P < .001). Serum FT4 concentrations did not differ significantly between diagnosis and final follow-up (1.48 [IQR, 1.12–2.06] vs. 1.39 [IQR, 1.08–1.76] ng/dL, P = .492). The FT3/FT4 ratio decreased significantly from 3.42 ± 1.08 to 2.79 ± 0.81 (P < .001). Serum TRAb levels decreased from 5.25 (IQR, 2.80–9.85) to 2.43 (IQR, 1.22–4.86) IU/L (P < .001), anti-TPO levels decreased from 267 (IQR, 153–467) to 163 (IQR, 87–303) IU/mL (P < .001), and anti-Tg levels decreased from 59 (IQR, 22–158) to 43 (IQR, 17–107) IU/mL (P = .003). Among the hematological parameters, neutrophil and platelet counts increased significantly (P = .048 and P = .016, respectively), whereas no significant changes were observed in lymphocyte counts (2.48 [IQR, 2.04–2.98] vs. 2.54 [IQR, 2.08–3.06] × 10⁹/L, P = .331) or monocyte counts (0.61 [IQR, 0.48–0.76] vs. 0.59 [IQR, 0.46–0.73] × 10⁹/L, P = .229). C-reactive protein, albumin, and HDL cholesterol levels did not differ significantly between the two assessments (Table 2). Changes in hematological inflammatory indices between diagnosis and follow-up are shown in Table 3. The neutrophil-to-lymphocyte ratio (NLR) decreased from 2.38 ± 0.86 to 1.89 ± 0.63 (P < .001). The platelet-to-lymphocyte ratio (PLR) declined from 141.8 ± 38.6 to 129.5 ± 34.2 (P = .003), while the systemic immune-inflammation index (SII) decreased from 604 ± 221 to 487 ± 176 (P < .001). Significant reductions were also observed in the neutrophil-to-platelet ratio (NPR) (0.0198 ± 0.0056 vs. 0.0162 ± 0.0048, P < .001), monocyte-to-HDL cholesterol ratio (MHR) (0.0127 ± 0.0041 vs. 0.0104 ± 0.0033, P < .001), and C-reactive protein-to-albumin ratio (CAR) (0.094 ± 0.036 vs. 0.066 ± 0.027, P < .001) (Table 3). Correlations between hematological inflammatory indices and thyroid function and autoimmunity parameters at diagnosis are shown in Supplementary Table 1. Among the thyroid autoimmunity markers, Anti-TPO levels were negatively correlated with NLR (ρ = −0.186, P = .020) and NPR (ρ = −0.164, P = .042). Anti-Tg levels demonstrated negative correlations with NLR (ρ = −0.271, P < .001), SII (ρ = −0.274, P < .001), and NPR (ρ = −0.204, P = .012). MHR was positively correlated with CRP (ρ = 0.236, P = .036), whereas CAR showed a very strong positive correlation with CRP (ρ = 0.989, P < .001). PLR was positively correlated with HDL cholesterol (ρ = 0.183, P = .020) (Supplementary Table 1, Figure 2). Diagnostic performance of baseline hematological inflammatory indices for predicting persistent TRAb positivity at final follow-up is shown in Supplementary Table 2. The AUC values ranged from 0.653 (95% CI, 0.570–0.736) for PLR to 0.821 (95% CI, 0.756–0.886) for CAR. CAR showed the highest sensitivity (79.5%), specificity (75.8%), positive predictive value (84.0%), and negative predictive value (69.5%) at an optimal cut-off value of >0.089. MHR and NPR also demonstrated good diagnostic performance, with AUCs of 0.782 (95% CI, 0.713–0.851) and 0.764 (95% CI, 0.692–0.836), respectively. NLR yielded an AUC of 0.718 (95% CI, 0.640–0.796), whereas PLR had the lowest AUC (0.653; 95% CI, 0.570–0.736) (Supplementary Table 2, Figure 3). Multivariable logistic regression analysis for predictors of TRAb positivity is shown in Supplementary Table 3. Age (adjusted OR = 0.98, 95% CI: 0.95–1.01, P = .176), female sex (adjusted OR = 1.21, 95% CI: 0.64–2.30, P = .558), NLR (adjusted OR = 1.28, 95% CI: 0.99–1.67, P = .061), PLR (P = .287), and SII (P = .142) were not independently associated with TRAb positivity. In contrast, NPR (adjusted OR = 1.69, 95% CI: 1.09–2.64, P = .025), MHR (adjusted OR = 2.03, 95% CI: 1.26–3.28, P = .004) and CAR (adjusted OR = 2.58, 95% CI: 1.56–4.28, P < .001) were independently associated with TRAb positivity. The final multivariable model had a −2 log likelihood of 165.4, a Nagelkerke R² of 0.34, a non-significant Hosmer–Lemeshow goodness-of-fit test (P = .58), an overall classification accuracy of 79.6%, and an area under the receiver operating characteristic curve (AUC) of 0.852 (95% CI: 0.790–0.914) (Supplementary Table 3).Discussion
The present study demonstrated that hematological and inflammation-related indices changed significantly during follow-up in patients with Graves’ disease. NLR, PLR, SII, NPR, MHR, and CAR were all lower at the final assessment than at diagnosis, in parallel with the improvement in TSH, FT3, FT3/FT4 ratio, TRAb, anti-TPO, and anti-Tg levels. Among the evaluated indices, CAR showed the strongest relationship and provided the highest discriminatory performance for TRAb positivity. MHR and NPR also showed relatively favorable diagnostic performance, whereas PLR and SII had weaker discriminatory ability. In the multivariable analyses, NPR, CAR and MHR remained independently associated with TRAb positivity. These findings suggest that indices incorporating conventional inflammatory, metabolic, and hematological components may reflect different dimensions of Graves’ disease-associated immune activation.
Turan et al. evaluated NLR and hematological parameters in patients with Graves’ disease and reported differences between untreated and euthyroid patients, supporting an association between thyroid status and peripheral blood-cell distributions.8 In contrast, Dağdeviren et al. found that patients with Graves’ disease had lower neutrophil counts and lower NLR values than patients with non-Graves hyperthyroidism and healthy controls; they also observed negative correlations between FT3 and both neutrophil count and NLR.16 The decline in NLR observed during follow-up in our cohort differs from studies reporting normalization or an increase in NLR after treatment. This discrepancy may be related to differences in baseline disease severity, treatment duration, leukocyte responses, inclusion criteria, and whether comparisons were made longitudinally within the same patients or cross-sectionally between untreated and euthyroid groups.
Cindoğlu et al. reported increases in leukocyte, neutrophil, lymphocyte, and NLR values after antithyroid treatment, while changes in platelet count and PLR were less consistent.19 Gökçe et al. similarly observed changes in the hematological profile after antithyroid therapy and reported a reduction in monocyte-to-lymphocyte ratio following treatment.20 These observations indicate that correction of thyrotoxicosis may modify several blood-cell lineages, although the direction and magnitude of change may vary among individual parameters. In our study, the concurrent reduction in multiple composite indices suggests that treatment-related changes were not limited to a single leukocyte population but involved the overall balance among neutrophils, lymphocytes, monocytes, platelets, CRP, albumin, and HDL cholesterol.
Gökduman et al. investigated 162 patients with Graves’ disease at diagnosis and after six months of antithyroid treatment and found significant reductions in PLR, MLR, FT3, and FT4 together with weak positive correlations of TSI with monocyte count and MLR.21 They did not identify a sufficiently reliable CBC-derived marker to replace TRAb, although monocyte-related parameters appeared to provide information on disease activation. Our findings partly support their results because monocyte-related inflammation was also relevant in the present cohort. The inclusion of HDL cholesterol in MHR may provide additional information by combining monocyte-mediated inflammatory activity with the anti-inflammatory and antioxidant properties associated with HDL.
Zeng et al. analyzed 6,963 adults from the NHANES database and reported that MHR was independently associated with several thyroid-function measures, including positive associations with FT3, total T3, and total T4 and an inverse association with TPOAb in categorical analyses.22 Although their population was not restricted to Graves’ disease, their results support a biological link between monocyte–HDL balance and thyroid physiology. In our study, MHR was not significantly correlated with FT3 or FT4, but it was independently predicted TRAb positivity. This difference may indicate that MHR is more closely related to autoimmune activity than to circulating thyroid-hormone concentrations in patients with established Graves’ disease.
Szydełko et al. examined NLR, MLR, and PLR in a large cohort of patients with Graves’ disease with and without orbitopathy and found that these indices were influenced by clinical characteristics, including orbitopathy and smoking status.14 Their findings emphasize that hematological inflammatory markers in Graves’ disease may reflect not only thyroid dysfunction but also the systemic and extrathyroidal inflammatory phenotype. In our cohort, the absence of significant correlations between NLR and TRAb or thyroid-hormone concentrations indicates that NLR should not be interpreted as a direct substitute for disease-specific biochemical tests.
Abounoori et al. prospectively compared novel blood-derived immunoinflammatory markers among patients with Graves’ orbitopathy, Graves’ disease without orbitopathy, and healthy controls and demonstrated that composite hematological indices differed according to the presence and activity of orbitopathy.23 These observations are consistent with the concept that systemic inflammatory indices may capture clinically relevant immune activation beyond conventional thyroid-function tests. Nevertheless, differences between patients with isolated thyroid disease and those with active orbital inflammation should be considered when comparing cut-off values and diagnostic performance across studies.
Dasgupta et al. reported that PLR was significantly lower in patients with Graves’ disease than in patients with subacute thyroiditis and euthyroid controls. They proposed a PLR cut-off of 70.4 for differentiating Graves’ disease from subacute thyroiditis, with 86% sensitivity and 74% specificity.24 Their study addressed etiological discrimination among patients with thyrotoxicosis, whereas our analysis assessed the ability of PLR to identify TRAb positivity within a Graves’ disease cohort. In our study, PLR had the lowest AUC among the evaluated indices for TRAb positivity. Therefore, PLR may have greater value in differentiating causes of thyrotoxicosis than in estimating the intensity of TSH-receptor-directed autoimmunity among patients already diagnosed with Graves’ disease.
The reduction in SII during follow-up observed in our study supports a decline in combined neutrophil-, lymphocyte-, and platelet-related inflammatory activity. However, SII showed only modest diagnostic performance and did not remain independently associated with TRAb positivity after multivariable adjustment. Gökduman et al. did not observe a significant overall change in SII after six months of treatment, although they reported a reduction in the pan-immune-inflammation value in patients with severe disease.21 The difference from our findings may be attributable to the longer and heterogeneous follow-up period in our cohort, variation in disease severity, and differences in the relative changes in neutrophil, lymphocyte, and platelet counts. Because SII is mathematically dependent on all three components, proportional or opposing changes in these cell populations may substantially alter its performance.
CAR provided the strongest diagnostic performance in the present study, with AUC values of 0.821 for TRAb positivity. It also remained the strongest independent predictor in both multivariable models. CAR integrates CRP, an acute-phase reactant reflecting inflammatory signaling, with albumin, which may decline in the presence of systemic inflammation and altered nutritional or hepatic status. The near-perfect correlation between CAR and CRP in our dataset indicates that CAR was predominantly driven by CRP variation, because albumin concentrations remained relatively stable. Accordingly, the superior performance of CAR should not automatically be interpreted as evidence that it is biologically superior to CRP alone. Direct comparison of CAR with CRP using paired ROC analysis would be useful before recommending CAR as an incremental biomarker.
The positive associations of CAR, MHR, NPR, SII, and NLR with TRAb. This may reflect differences between the assays. TRAb-binding assays may detect stimulating, blocking, and neutral antibodies. Consequently, systemic inflammatory activation may be more closely aligned with the biologically stimulating antibody component than with total TSH-receptor antibody binding. The absence of meaningful associations with TSH, FT3, and FT4 further suggests that these inflammatory indices may reflect autoimmune and inflammatory activity rather than the biochemical severity of thyrotoxicosis itself.
The negative correlations between anti-Tg and both NLR and SII, which remained significant after false-discovery-rate correction, were unexpected. Anti-TPO and anti-Tg represent thyroid-directed autoimmunity but are not specific measures of TSH-receptor stimulation or Graves’ disease activity. Therefore, higher concentrations of these antibodies may not parallel the neutrophil-, lymphocyte-, and platelet-mediated inflammatory response. Similar inverse associations have also been reported between MHR and TPOAb in population-based data.22 These inverse relationships should be considered exploratory and require confirmation in prospectively characterized cohorts.
The ROC findings should be interpreted as evidence of association and discrimination rather than proof that the evaluated indices can replace TRAb. CAR, MHR, and NPR are influenced by infection, obesity, smoking, dyslipidemia, medication use, nutritional status, cardiovascular disease, and other inflammatory conditions. Although several major confounding diseases were excluded, residual confounding cannot be eliminated in a retrospective study. In addition, cut-off values derived from the same cohort in which performance was evaluated are susceptible to optimism and require external validation. The relatively high PPV and lower NPV values were also influenced by the prevalence of antibody positivity in the study population and may differ considerably in other clinical settings.
Limitations
The principal strengths of this study include the paired assessment of patients at diagnosis and follow-up, simultaneous evaluation of several CBC- and biochemistry-derived indices, examination of both TRAb, correction for multiple correlation testing, and the use of ROC and multivariable regression analyses. Nevertheless, several limitations should be acknowledged. The retrospective and single-center design limits causal inference and generalizability. Treatment duration and treatment exposure were heterogeneous, and the cohort consisted predominantly of patients receiving methimazole. Potential determinants of inflammatory indices, including body mass index, disease duration, medication dose, thyroid volume, orbitopathy activity, lipid-lowering therapy, and subclinical infections, could not be fully controlled. The study did not include healthy controls, patients with non-Graves hyperthyroidism, or an external validation cohort. Furthermore, the positivity thresholds and analytical characteristics of the TRAb assays should be reported in detail because diagnostic performance may vary between assay platforms.
Conclusion
In conclusion, the present findings indicate that Graves’ disease is accompanied by measurable alterations in routinely available hematological and biochemical inflammatory indices. NPR, CAR and MHR demonstrated the most consistent associations with TRAb positivity. These indices may be useful as complementary measures of systemic inflammatory and autoimmune activity, particularly when interpreted together with thyroid-function tests and TSH-receptor antibodies. However, they should not replace TRAb testing until their incremental value, reproducibility, and externally validated cut-off values have been established.
Declarations
Animal and Human Rights Statement
All procedures performed in this study were in accordance with the ethical standards of the institutional and/or national research committee and with the 1964 Helsinki Declaration and its later amendments or comparable ethical standards.
Informed Consent
Not applicable.
Data Availability
The datasets used and/or analyzed during the current study are not publicly available due to patient privacy reasons but are available from the corresponding author on reasonable request.
Conflict of Interest
The authors declare that there is no conflict of interest.
Funding
None.
References
- Ross DS, Burch HB, Cooper DS, et al. 2016 American Thyroid Association guidelines for diagnosis and management of hyperthyroidism and other causes of thyrotoxicosis. Thyroid. 2016;26(10):1343-1421. doi:10.1089/thy.2016.0229
- Korevaar TIM, Leung AM, Alexander EK, et al. American Thyroid Association 2026 guidelines for thyroid disease in preconception, pregnancy, and postpartum. Thyroid. 2026;36(5):481-544. doi:10.1177/10507256261445624
- Struja T, Kutz A, Fischli S, et al. Is Graves disease a primary immunodeficiency? New immunological perspectives on an endocrine disease. BMC Med. 2017;15(1). doi:10.1186/s12916-017-0939-9
- Ozturk S, Akyol EMB. Inflammatory signatures of Graves orbitopathy: linking thyroid autoimmunity, disease activity, and novel hematological biomarkers. Diagnostics (Basel). 2026;16(13). doi:10.3390/diagnostics16132132
- Rydzewska M, Jaromin M, Pasierowska IE, Stożek K, Bossowski A. Role of the T and B lymphocytes in pathogenesis of autoimmune thyroid diseases. Thyroid Res. 2018;11(1). doi:10.1186/s13044-018-0046-9
- Cao Y, Zhao X, You R, et al. CD11c+ B cells participate in the pathogenesis of Graves disease by secreting thyroid autoantibodies and cytokines. Front Immunol. 2022;13. doi:10.3389/fimmu.2022.836347
- He Q, Dong H, Gong M, et al. New therapeutic horizon of Graves hyperthyroidism: treatment regimens based on immunology and ingredients from traditional Chinese medicine. Front Pharmacol. 2022;13. doi:10.3389/fphar.2022.862831
- Turan E. Evaluation of neutrophil-to-lymphocyte ratio and hematologic parameters in patients with Graves disease. Bratisl Lek Listy. 2019;120(6):476-480. doi:10.4149/bll_2019_076
- Seğmen F, Aydemir S, Küçük O, Dokuyucu R. The roles of vitamin D levels, Gla-rich protein (GRP) and matrix Gla protein (MGP), and inflammatory markers in predicting mortality in intensive care patients: a new biomarker link? Metabolites. 2024;14(11). doi:10.3390/metabo14110620
- Ucar MA, Tombak A, Akdeniz A, et al. Immune and inflammation markers as a predictor of overall survival in patients with hematologic malignancies: a retrospective cohort study. Medicina (Kaunas). 2025;61(6). doi:10.3390/medicina61061019
- Atli H, Dayanan R. Evaluation of hematologic inflammatory markers in Graves disease. Fam Pract Palliat Care. 2023;8(5):112-117. doi:10.22391/fppc.1322984
- Bilgin M, Akkaya E, Dokuyucu R. Evaluation of inflammatory markers in predicting coronary complexity: insights from the SYNTAX II score in NSTEMI patients. J Clin Med. 2024;13(19). doi:10.3390/jcm13195940
- Farkas JD. The complete blood count to diagnose septic shock. J Thorac Dis. 2020;12(suppl 1). doi:10.21037/jtd.2019.12.63
- Szydełko J, Litwińczuk M, Szydełko M, Matyjaszek-Matuszek B. Neutrophil-to-lymphocyte, monocyte-to-lymphocyte, and platelet-to-lymphocyte ratios in relation to clinical parameters and smoking status in patients with Graves orbitopathy: novel insight into old tests. J Clin Med. 2020;9(10). doi:10.3390/jcm9103111
- Taşkaldiran I, Omma T, Önder ÇE, et al. Neutrophil-to-lymphocyte ratio, monocyte-to-lymphocyte ratio, and platelet-to-lymphocyte ratio in different etiological causes of thyrotoxicosis. Turk J Med Sci. 2019. doi:10.3906/sag-1901-116
- Dağdeviren M, Akkan T, Yapar D, et al. Can neutrophil/lymphocyte ratio be used as an indicator of inflammation in patients with hyperthyroidism? J Med Biochem. 2019;0(0). doi:10.2478/jomb-2019-0004
- Onyemekara D. Evaluation of inflammatory markers in Graves disease patients in Orlu, Imo State. IOASD J Med Pharm Sci. 2025.
- Yu X, Tang J, Wang L, et al. The diagnosis and treatment of hyperthyroidism: a bibliometric analysis from 2004 to 2024. Gland Surg. 2025;14(6):1140-1153. doi:10.21037/gs-2025-228
- Cindoglu Ç, Guler M, Eren MA, Sabuncu T. The evaluation of pretreatment and posttreatment platelet/lymphocyte and neutrophil/lymphocyte ratios in patients with hyperthyroidism. Harran Univ Tip Fak Derg. 2020;17(1):104-107.
- Gokce A, Omma T, Çelikc M, Taşkaldıran I. An overview of the hematological picture with antithyroid therapy in Graves disease. AFMN Biomed. 2021;39(4):467-475.
- Gökduman S, Özdemir N, Miskioğlu M, Akçura C, Bilgin Şahin B, Hekimsoy Z. The relationship between inflammatory parameters in hemogram and thyroid stimulating immunoglobulin (TSI) levels at the beginning and the 6th month of treatment in Graves disease. Celal Bayar Univ Saglik Bilim Enst Derg. 2025;12(1):125-133. doi:10.34087/cbusbed.1593450
- Zeng L, Yang S. Association between monocyte to high-density lipoprotein cholesterol ratio and thyroid function: a cross-sectional study. Sci Rep. 2025;15(1):25128. doi:10.1038/s41598-025-10501-4
- Abounoori M, Pourazizi M, Bahmani Kashkouli M, Akha O, Jafari R, Movahedirad M. Novel immunoinflammatory blood markers in Graves orbitopathy: insights into activity and severity. BMJ Open Ophthalmol. 2024;9(1):1-9. doi:10.1136/bmjophth-2024-001744
- Dasgupta R, Atri A, Jebasingh F, et al. Platelet-lymphocyte ratio as a novel surrogate marker to differentiate thyrotoxic patients with Graves disease from subacute thyroiditis: a cross-sectional study from South India. Endocr Pract. 2020;26(9):939-944. doi:10.4158/ep-2020-0086
Tables
Table 1. Baseline demographic and clinical characteristics of patients with Graves' disease (n = 161).
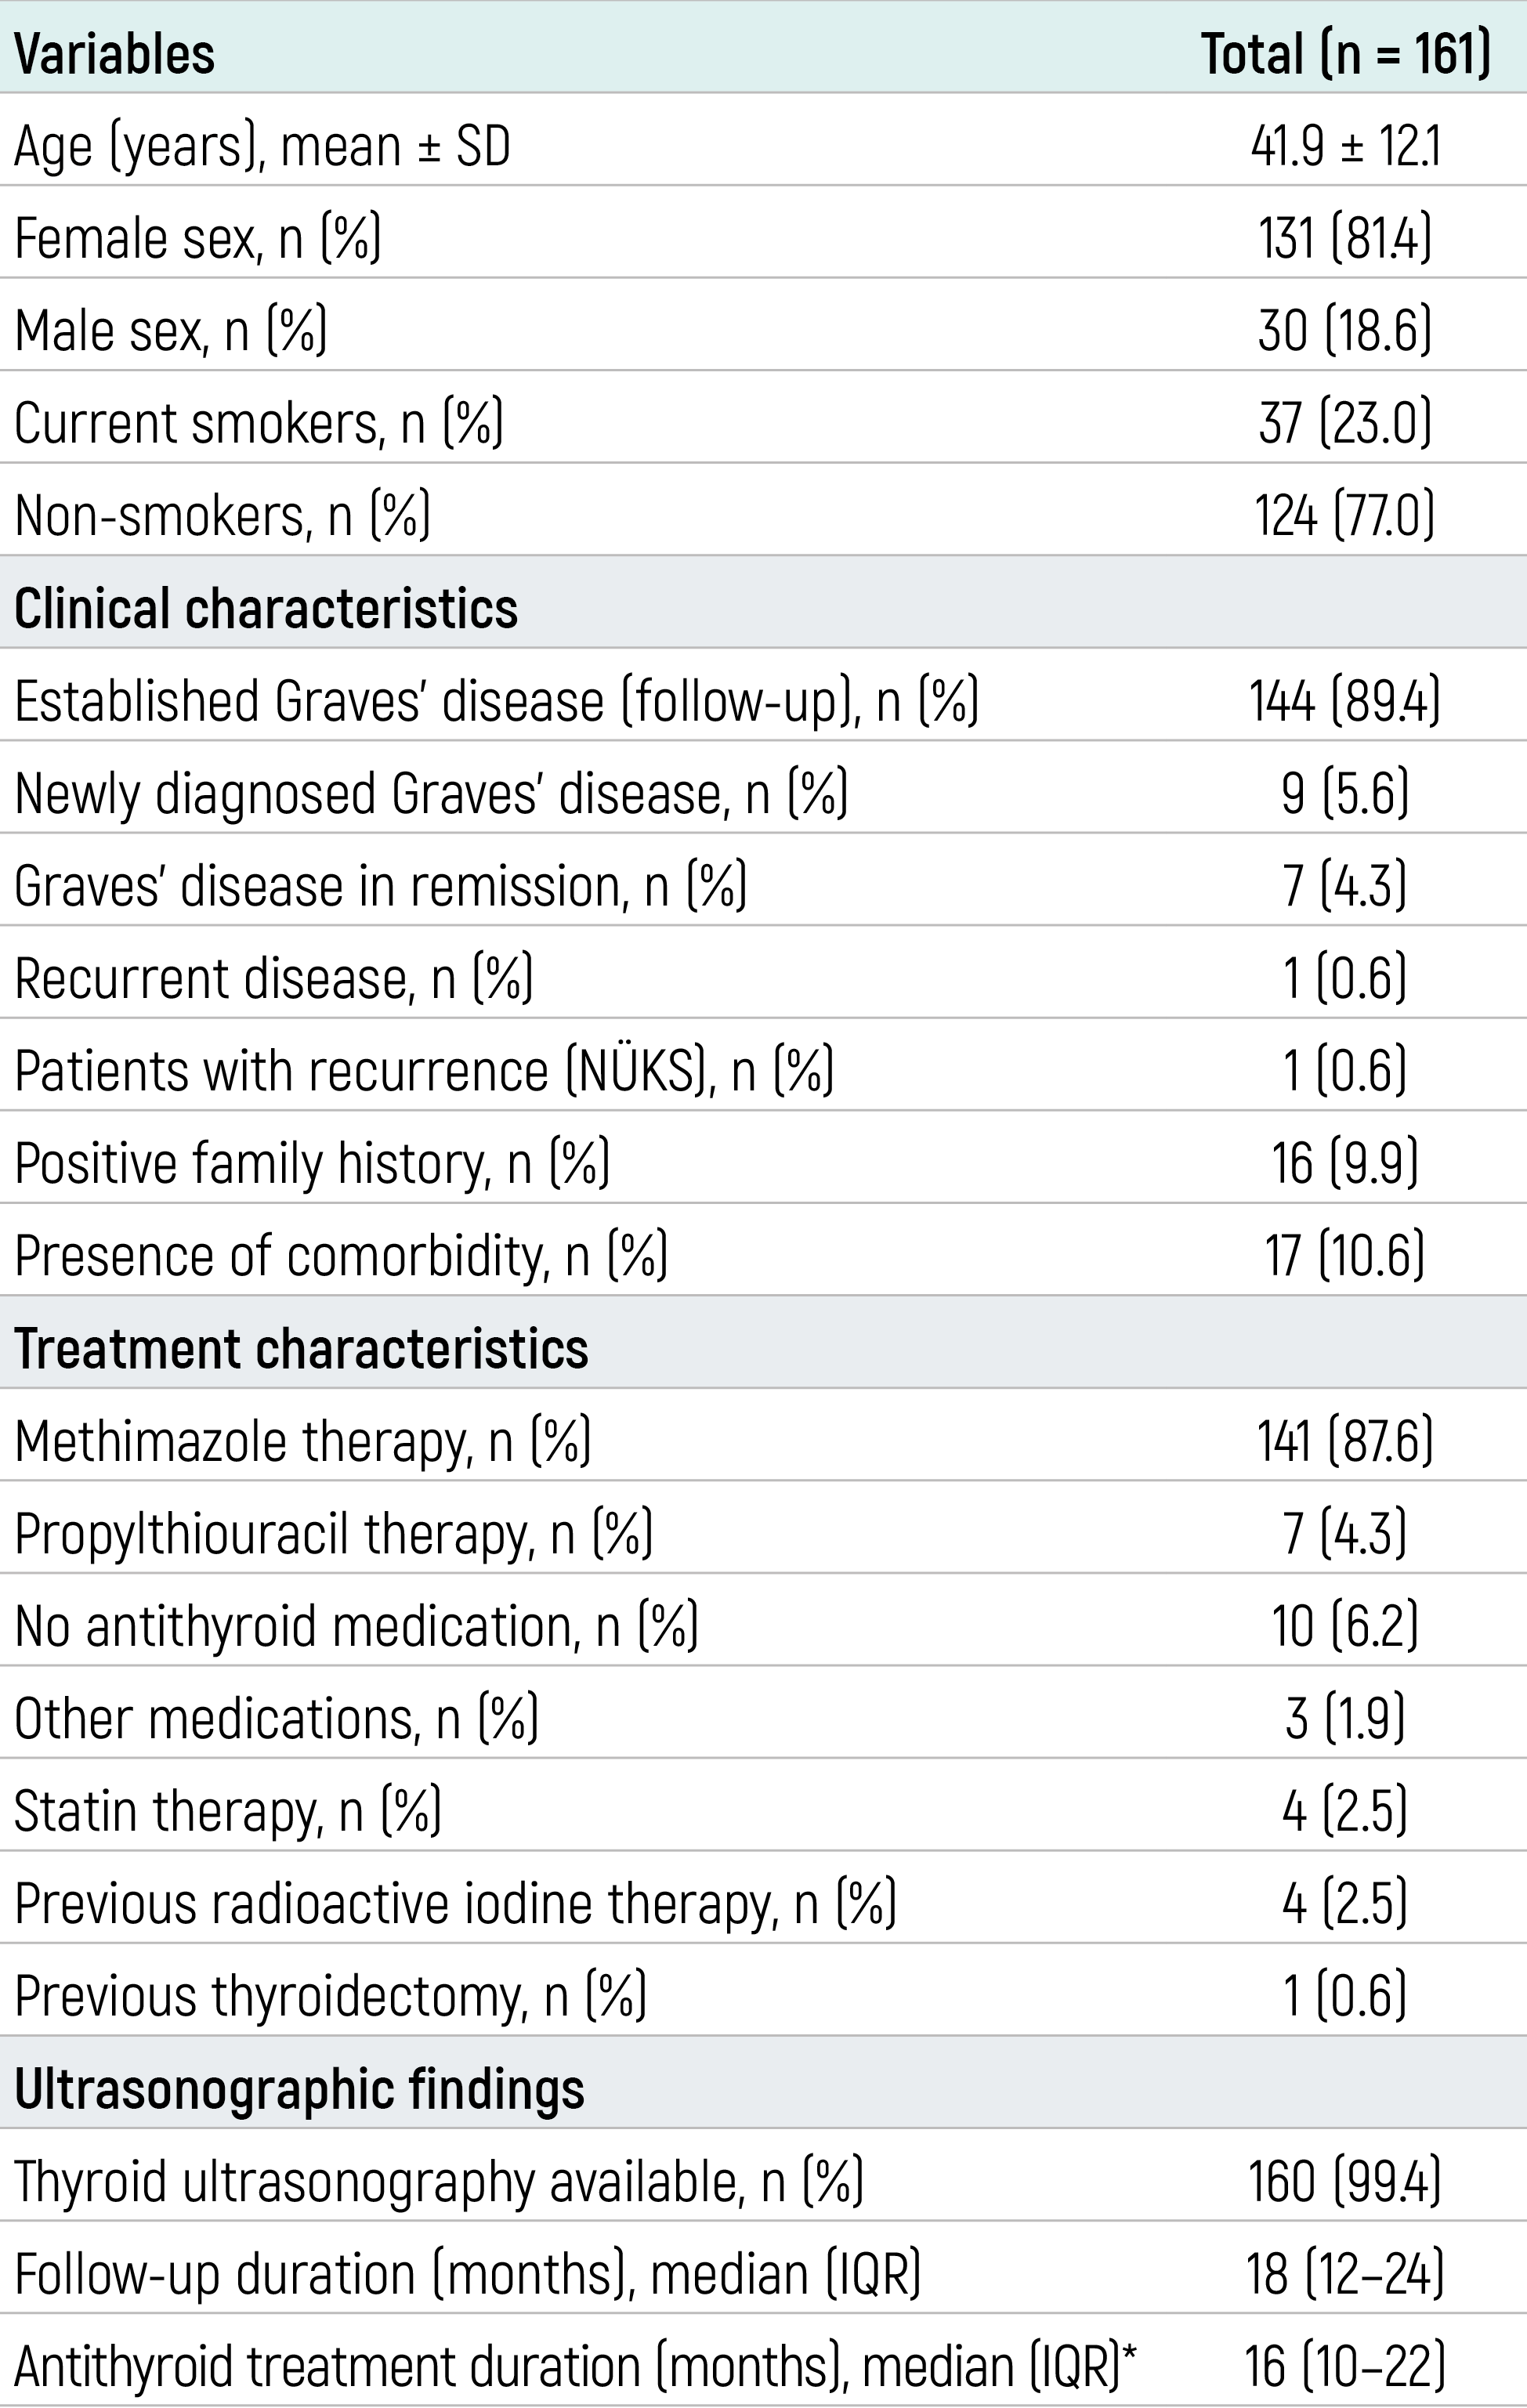
Data are presented as mean ± standard deviation (SD) or number (percentage), as appropriate. *Calculated among the 148 patients who received methimazole or propylthiouracil.
Table 2. Changes in thyroid function tests and routine laboratory parameters between diagnosis and follow-up.
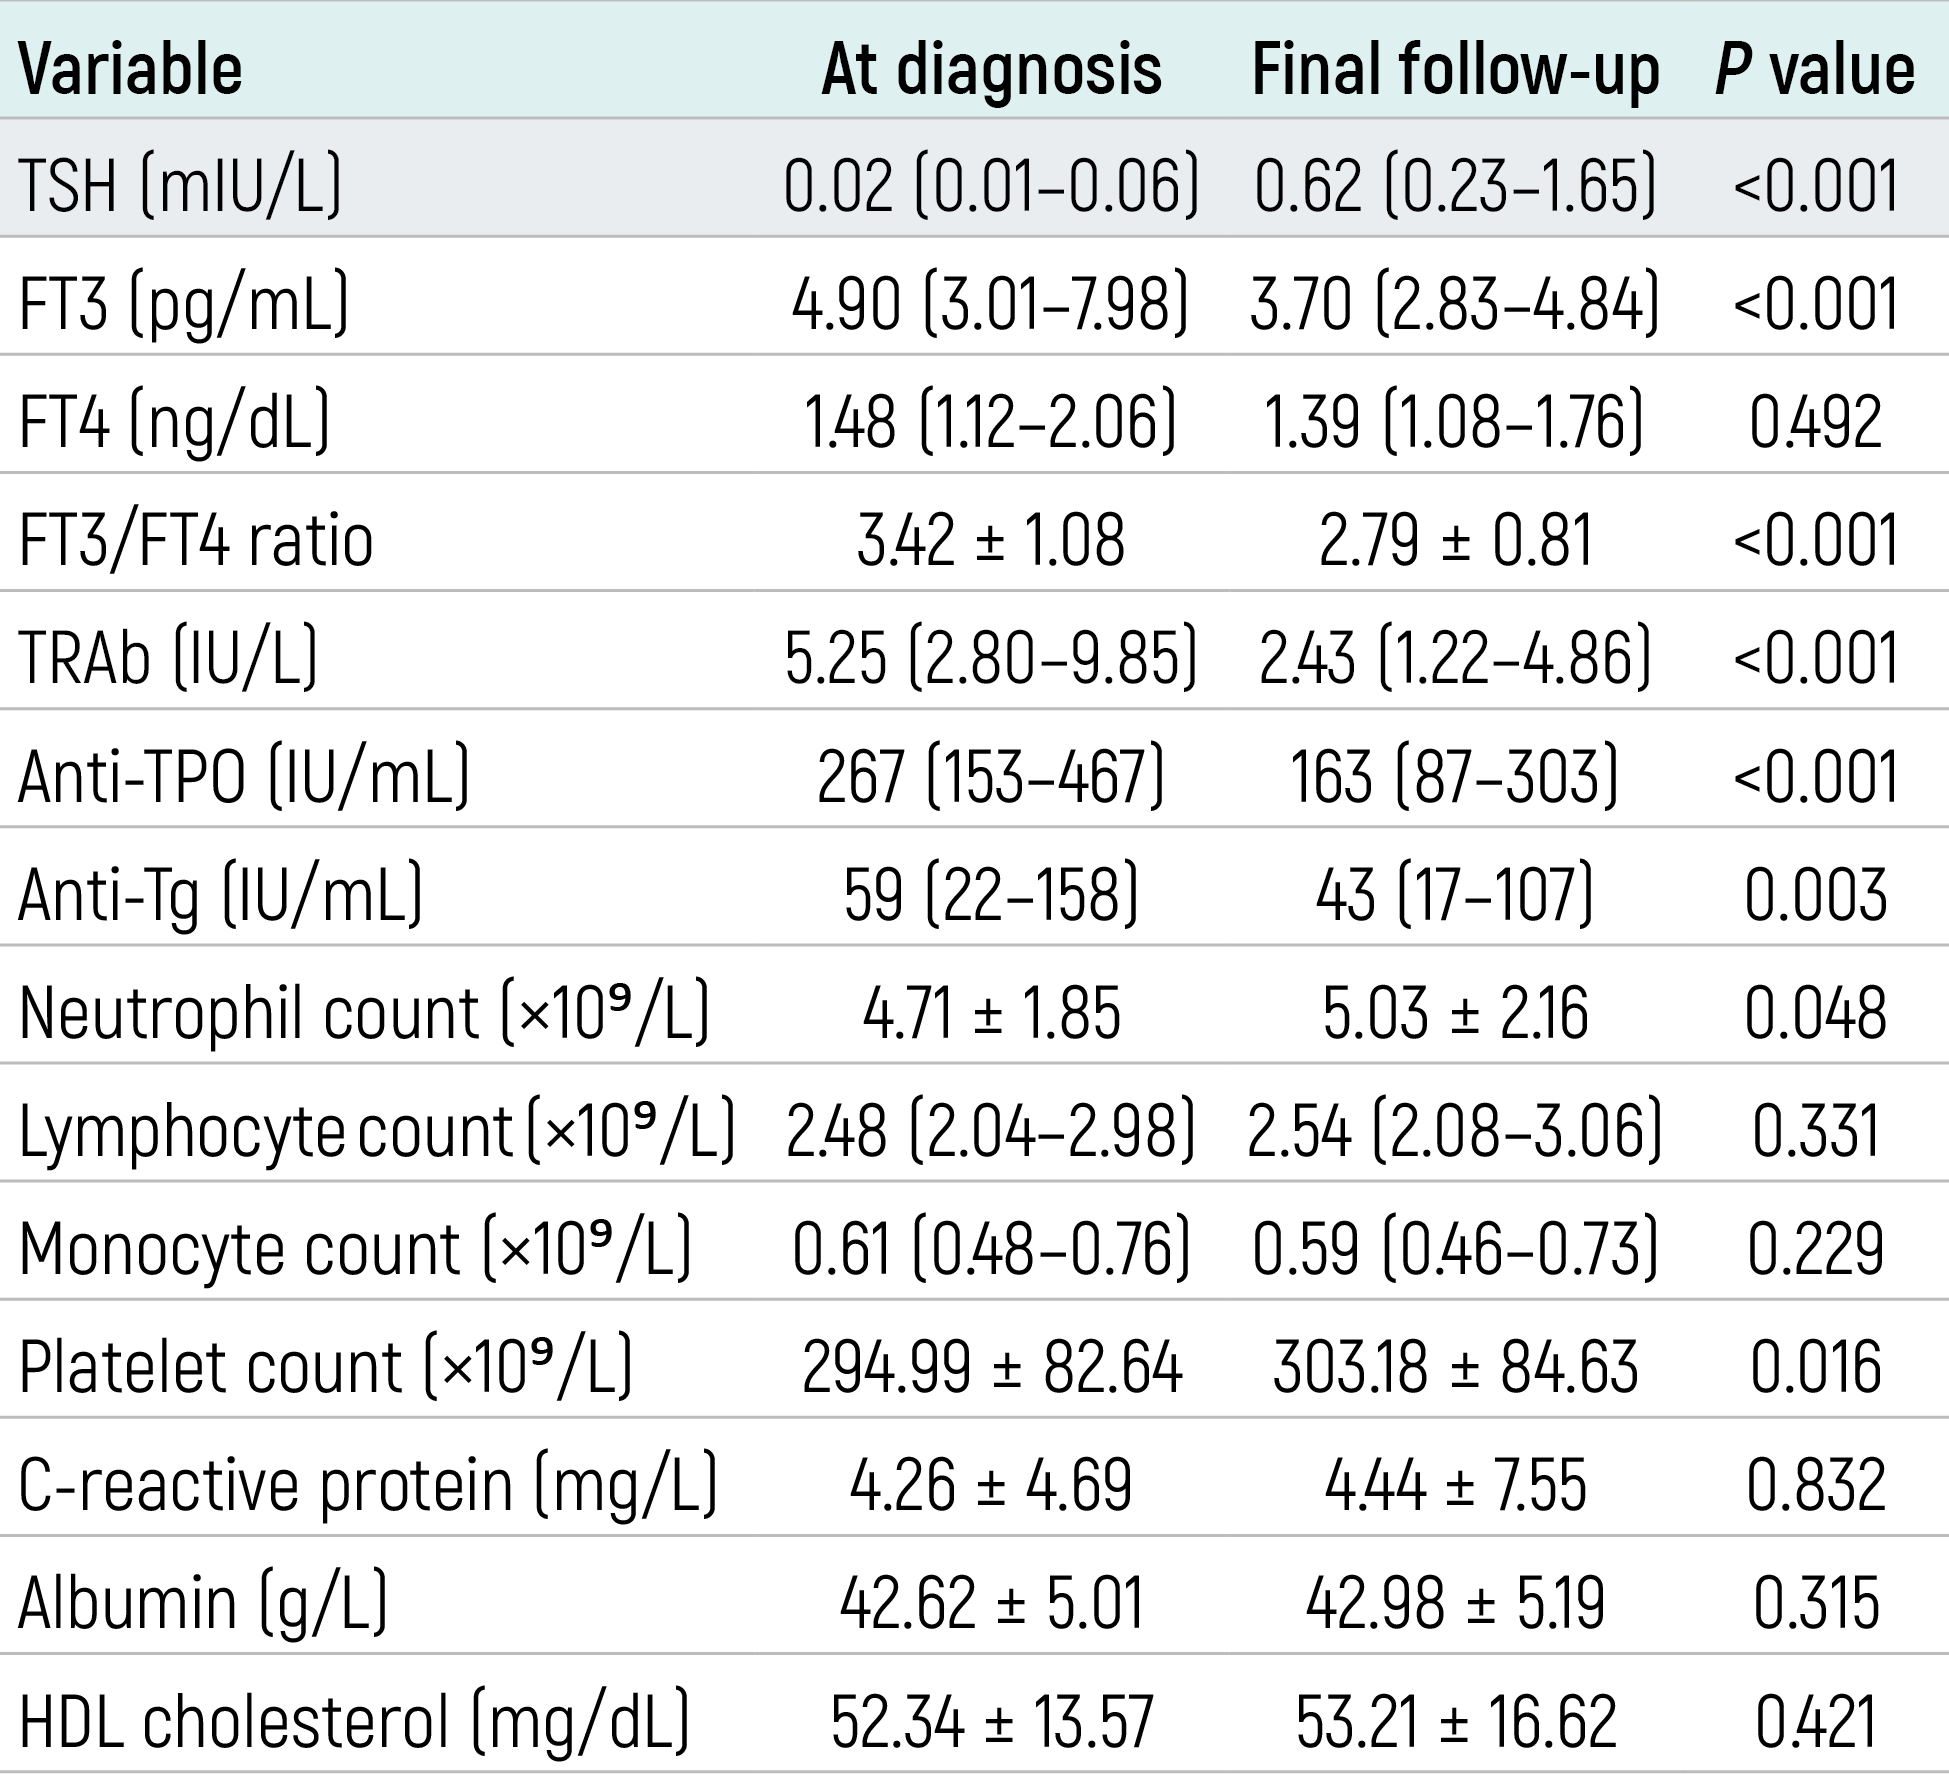
Data are presented as mean ± standard deviation or median (interquartile range), according to their distribution. Non-normally distributed paired variables were compared using the Wilcoxon signed-rank test.
Table 3. Changes in hematological inflammatory indices between diagnosis and follow-up.
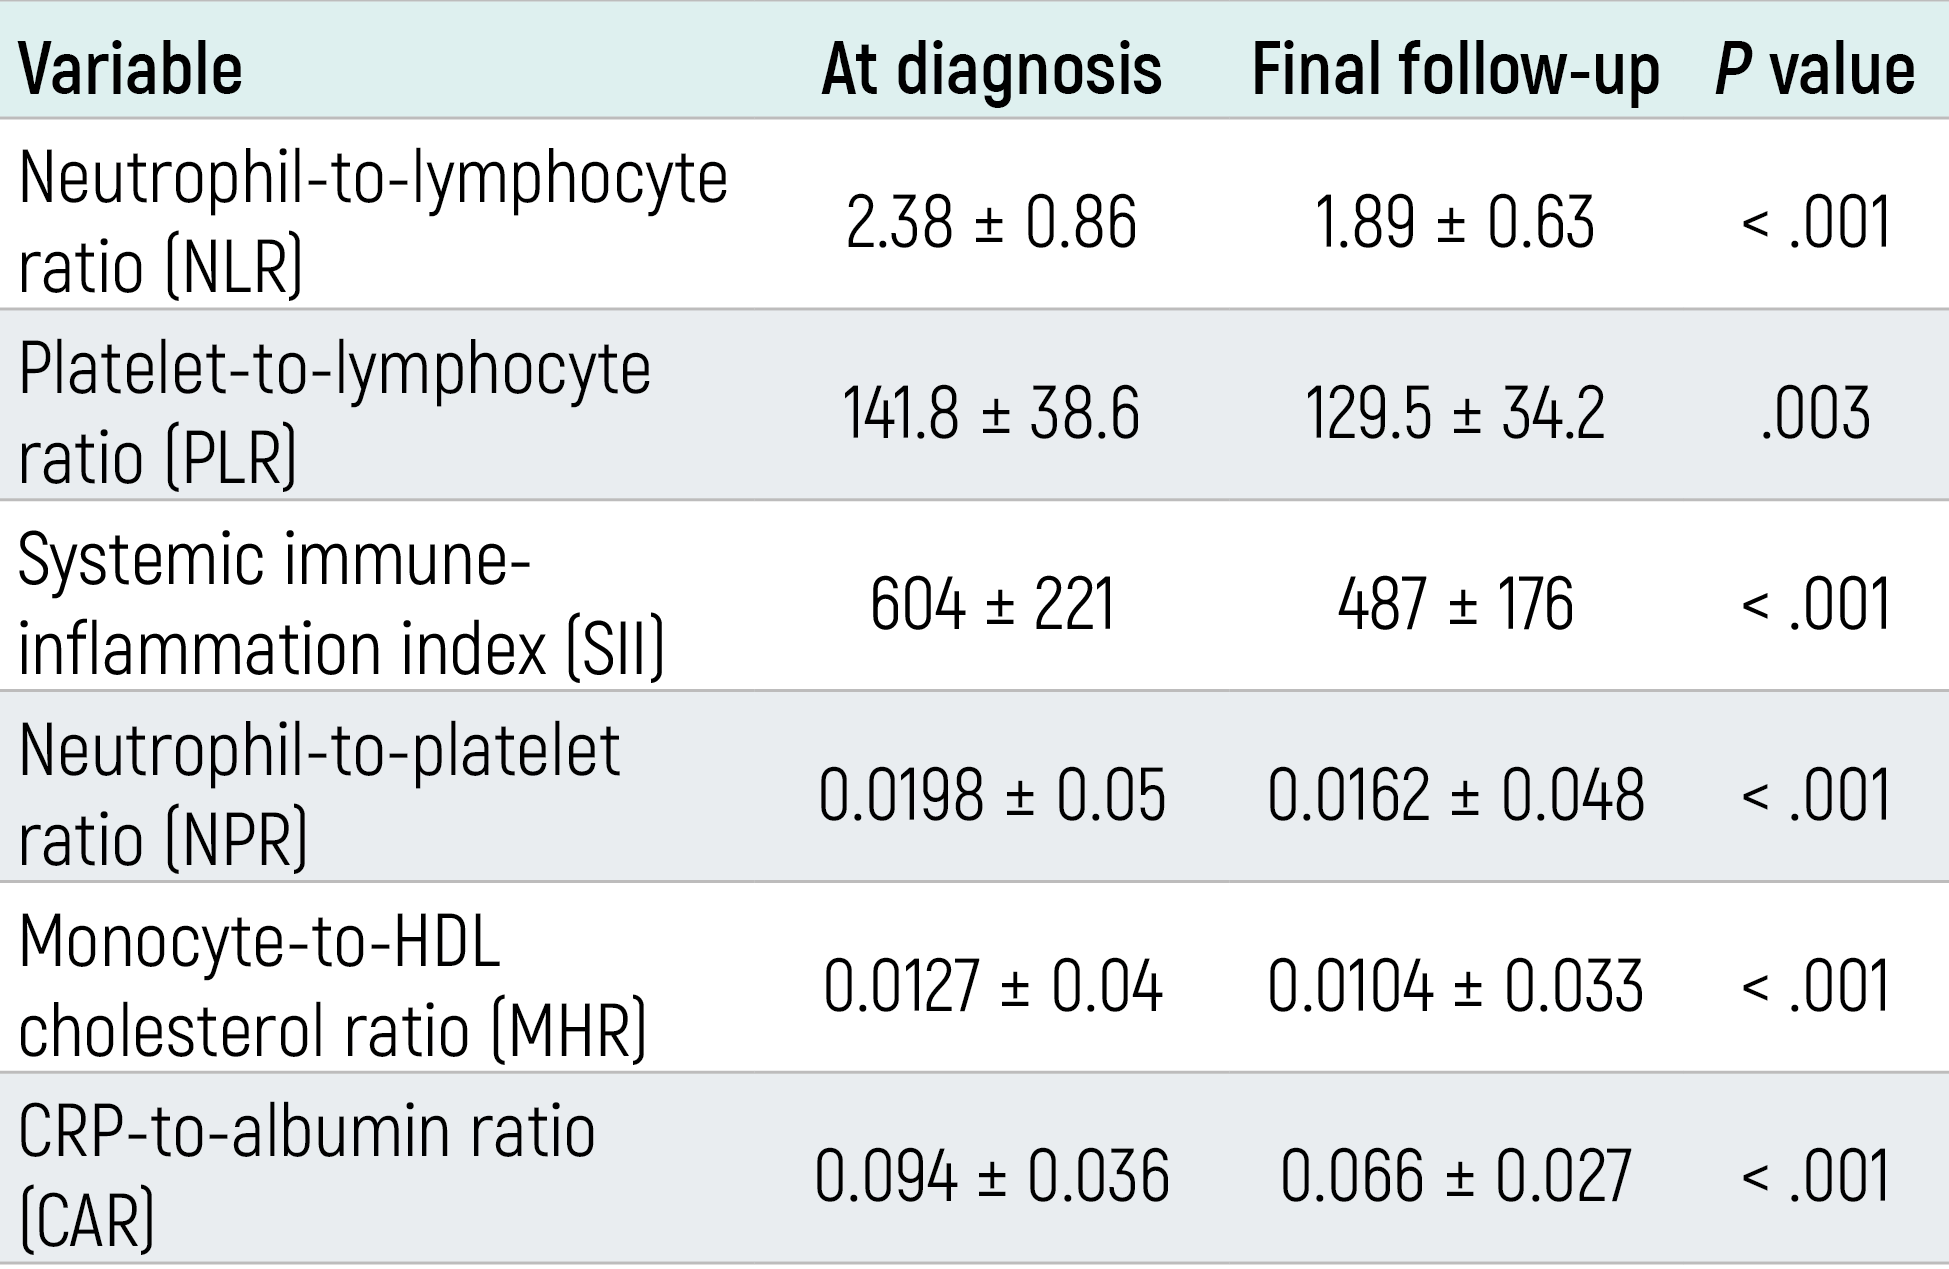
Data are presented as mean ± standard deviation. P values were calculated using paired-samples t-test or Wilcoxon signed-rank test according to data distribution.
Figures
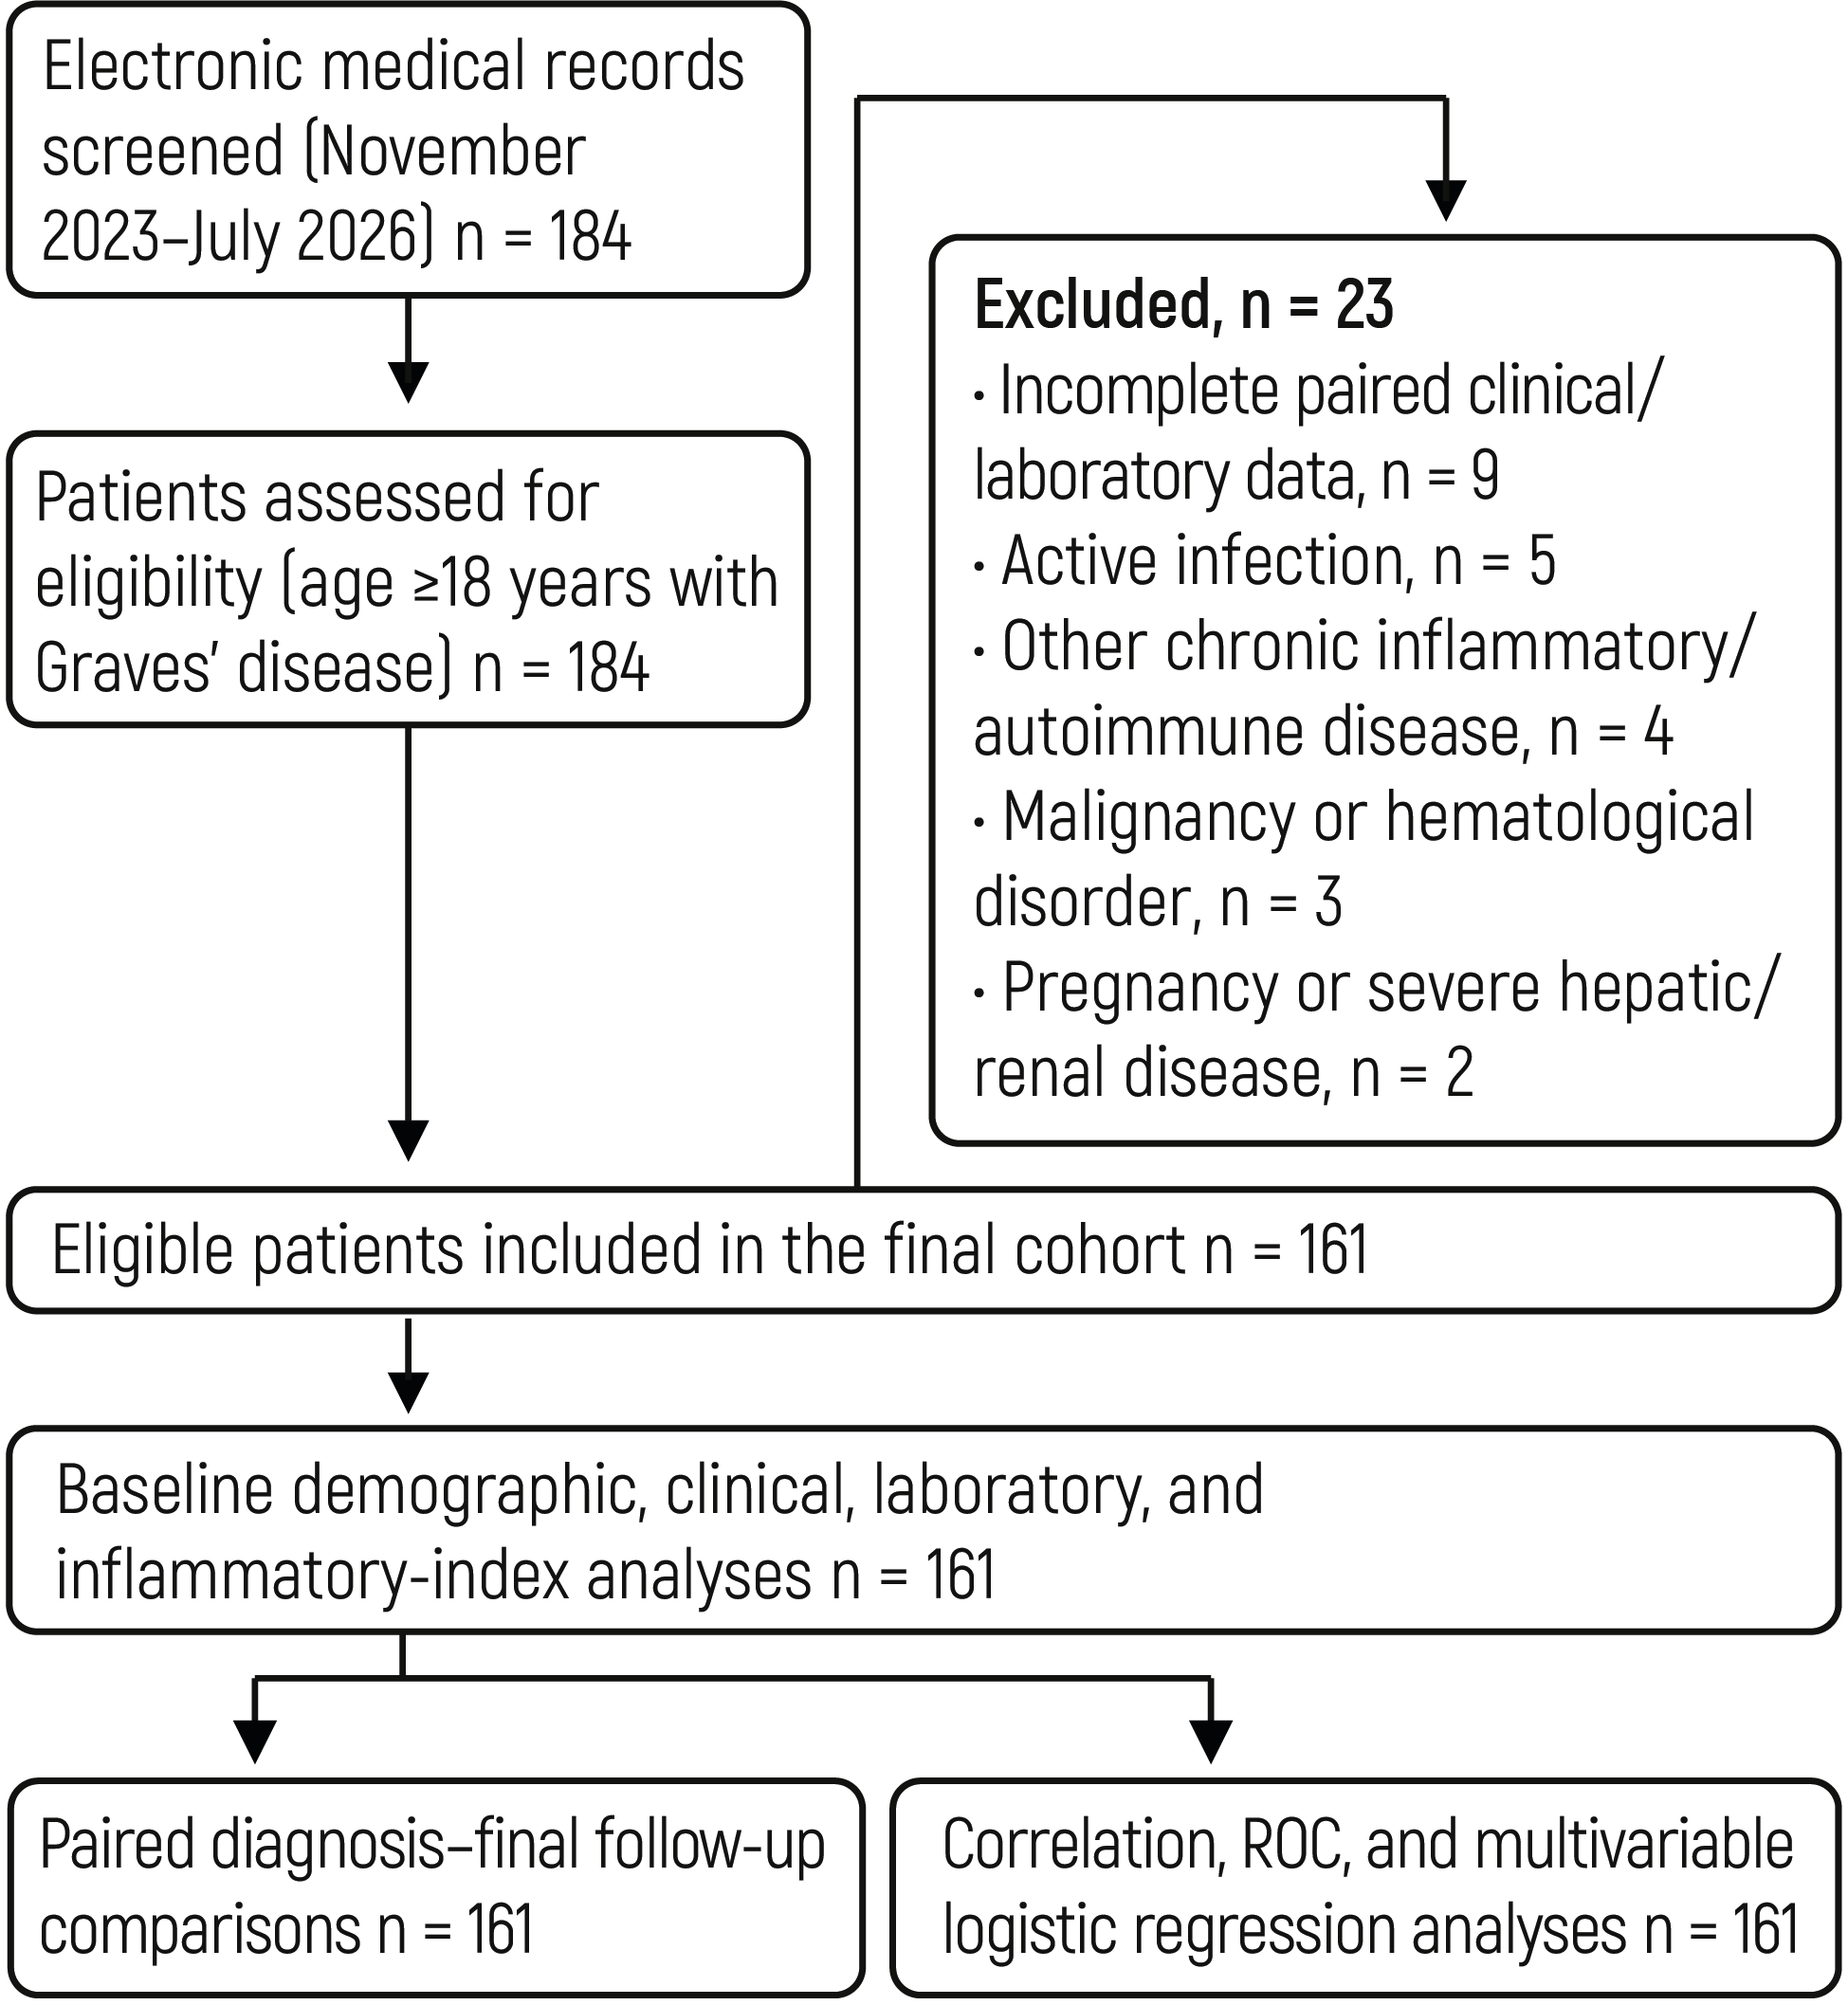
Figure 1. Study flow diagram of patient selection and study population.
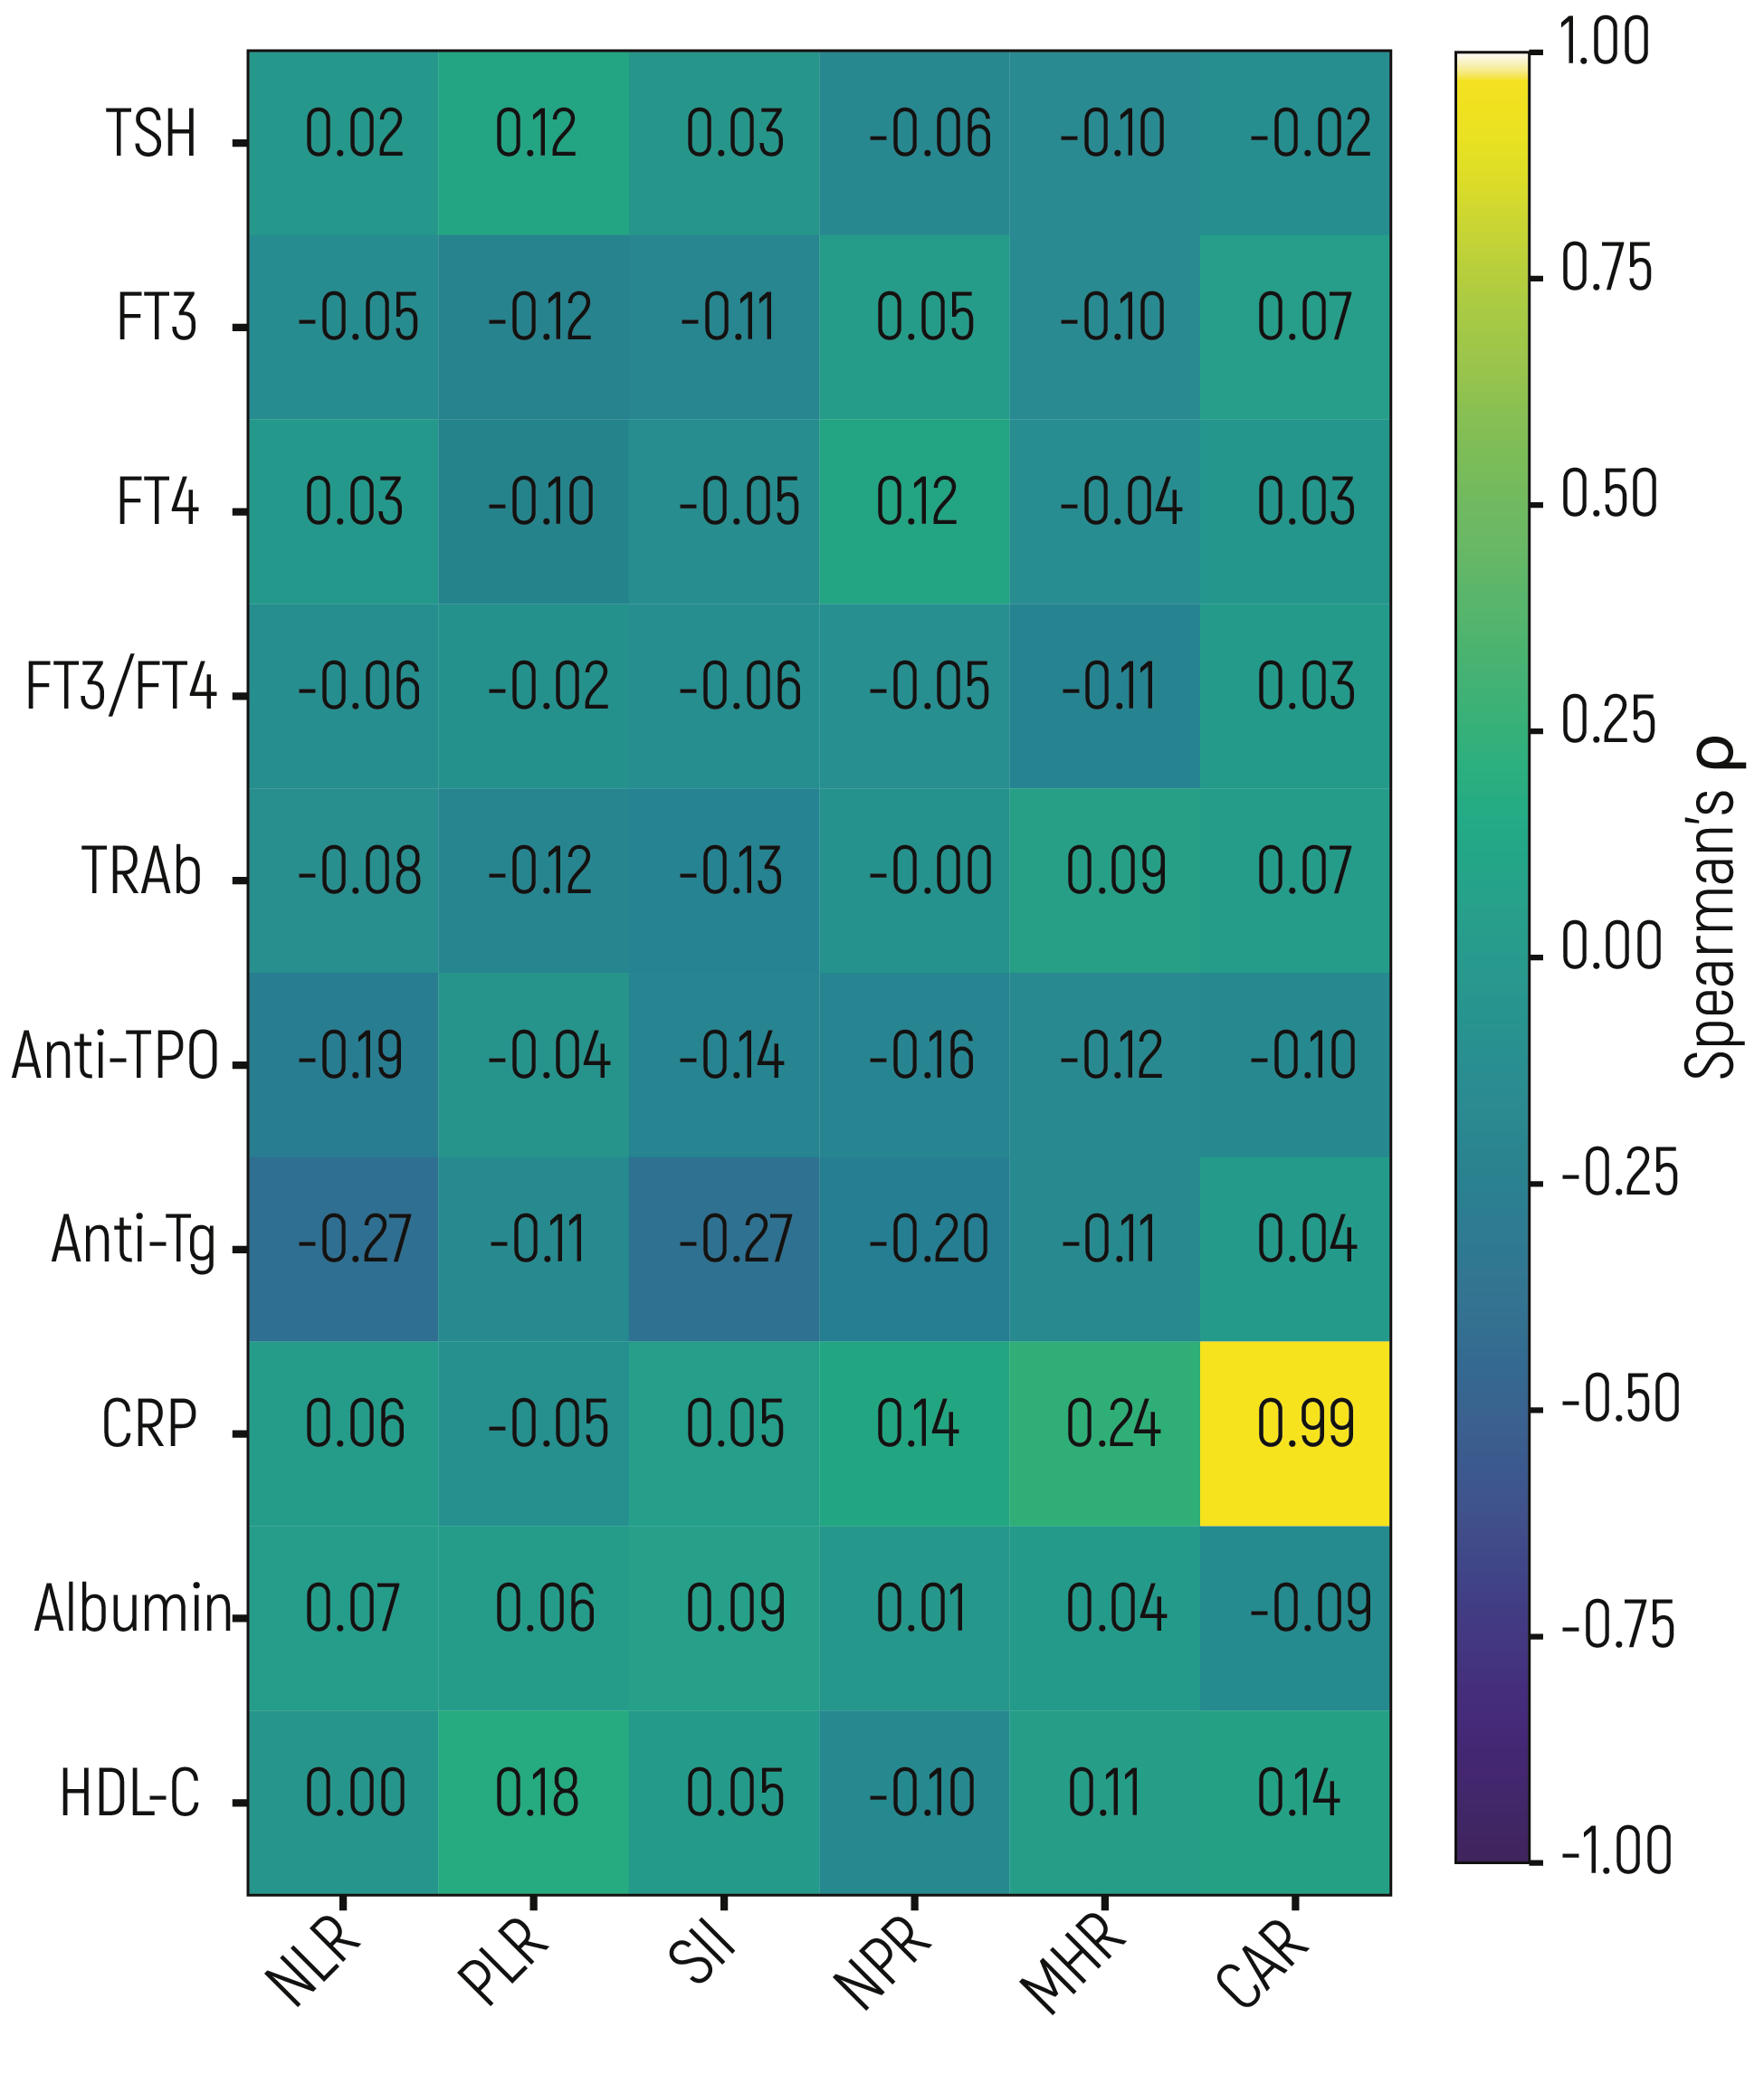
Figure 2. Spearman correlation heatmap showing the relationships among hematological inflammatory indices, thyroid function tests, thyroid autoantibodies, and inflammation-related laboratory parameters at diagnosis
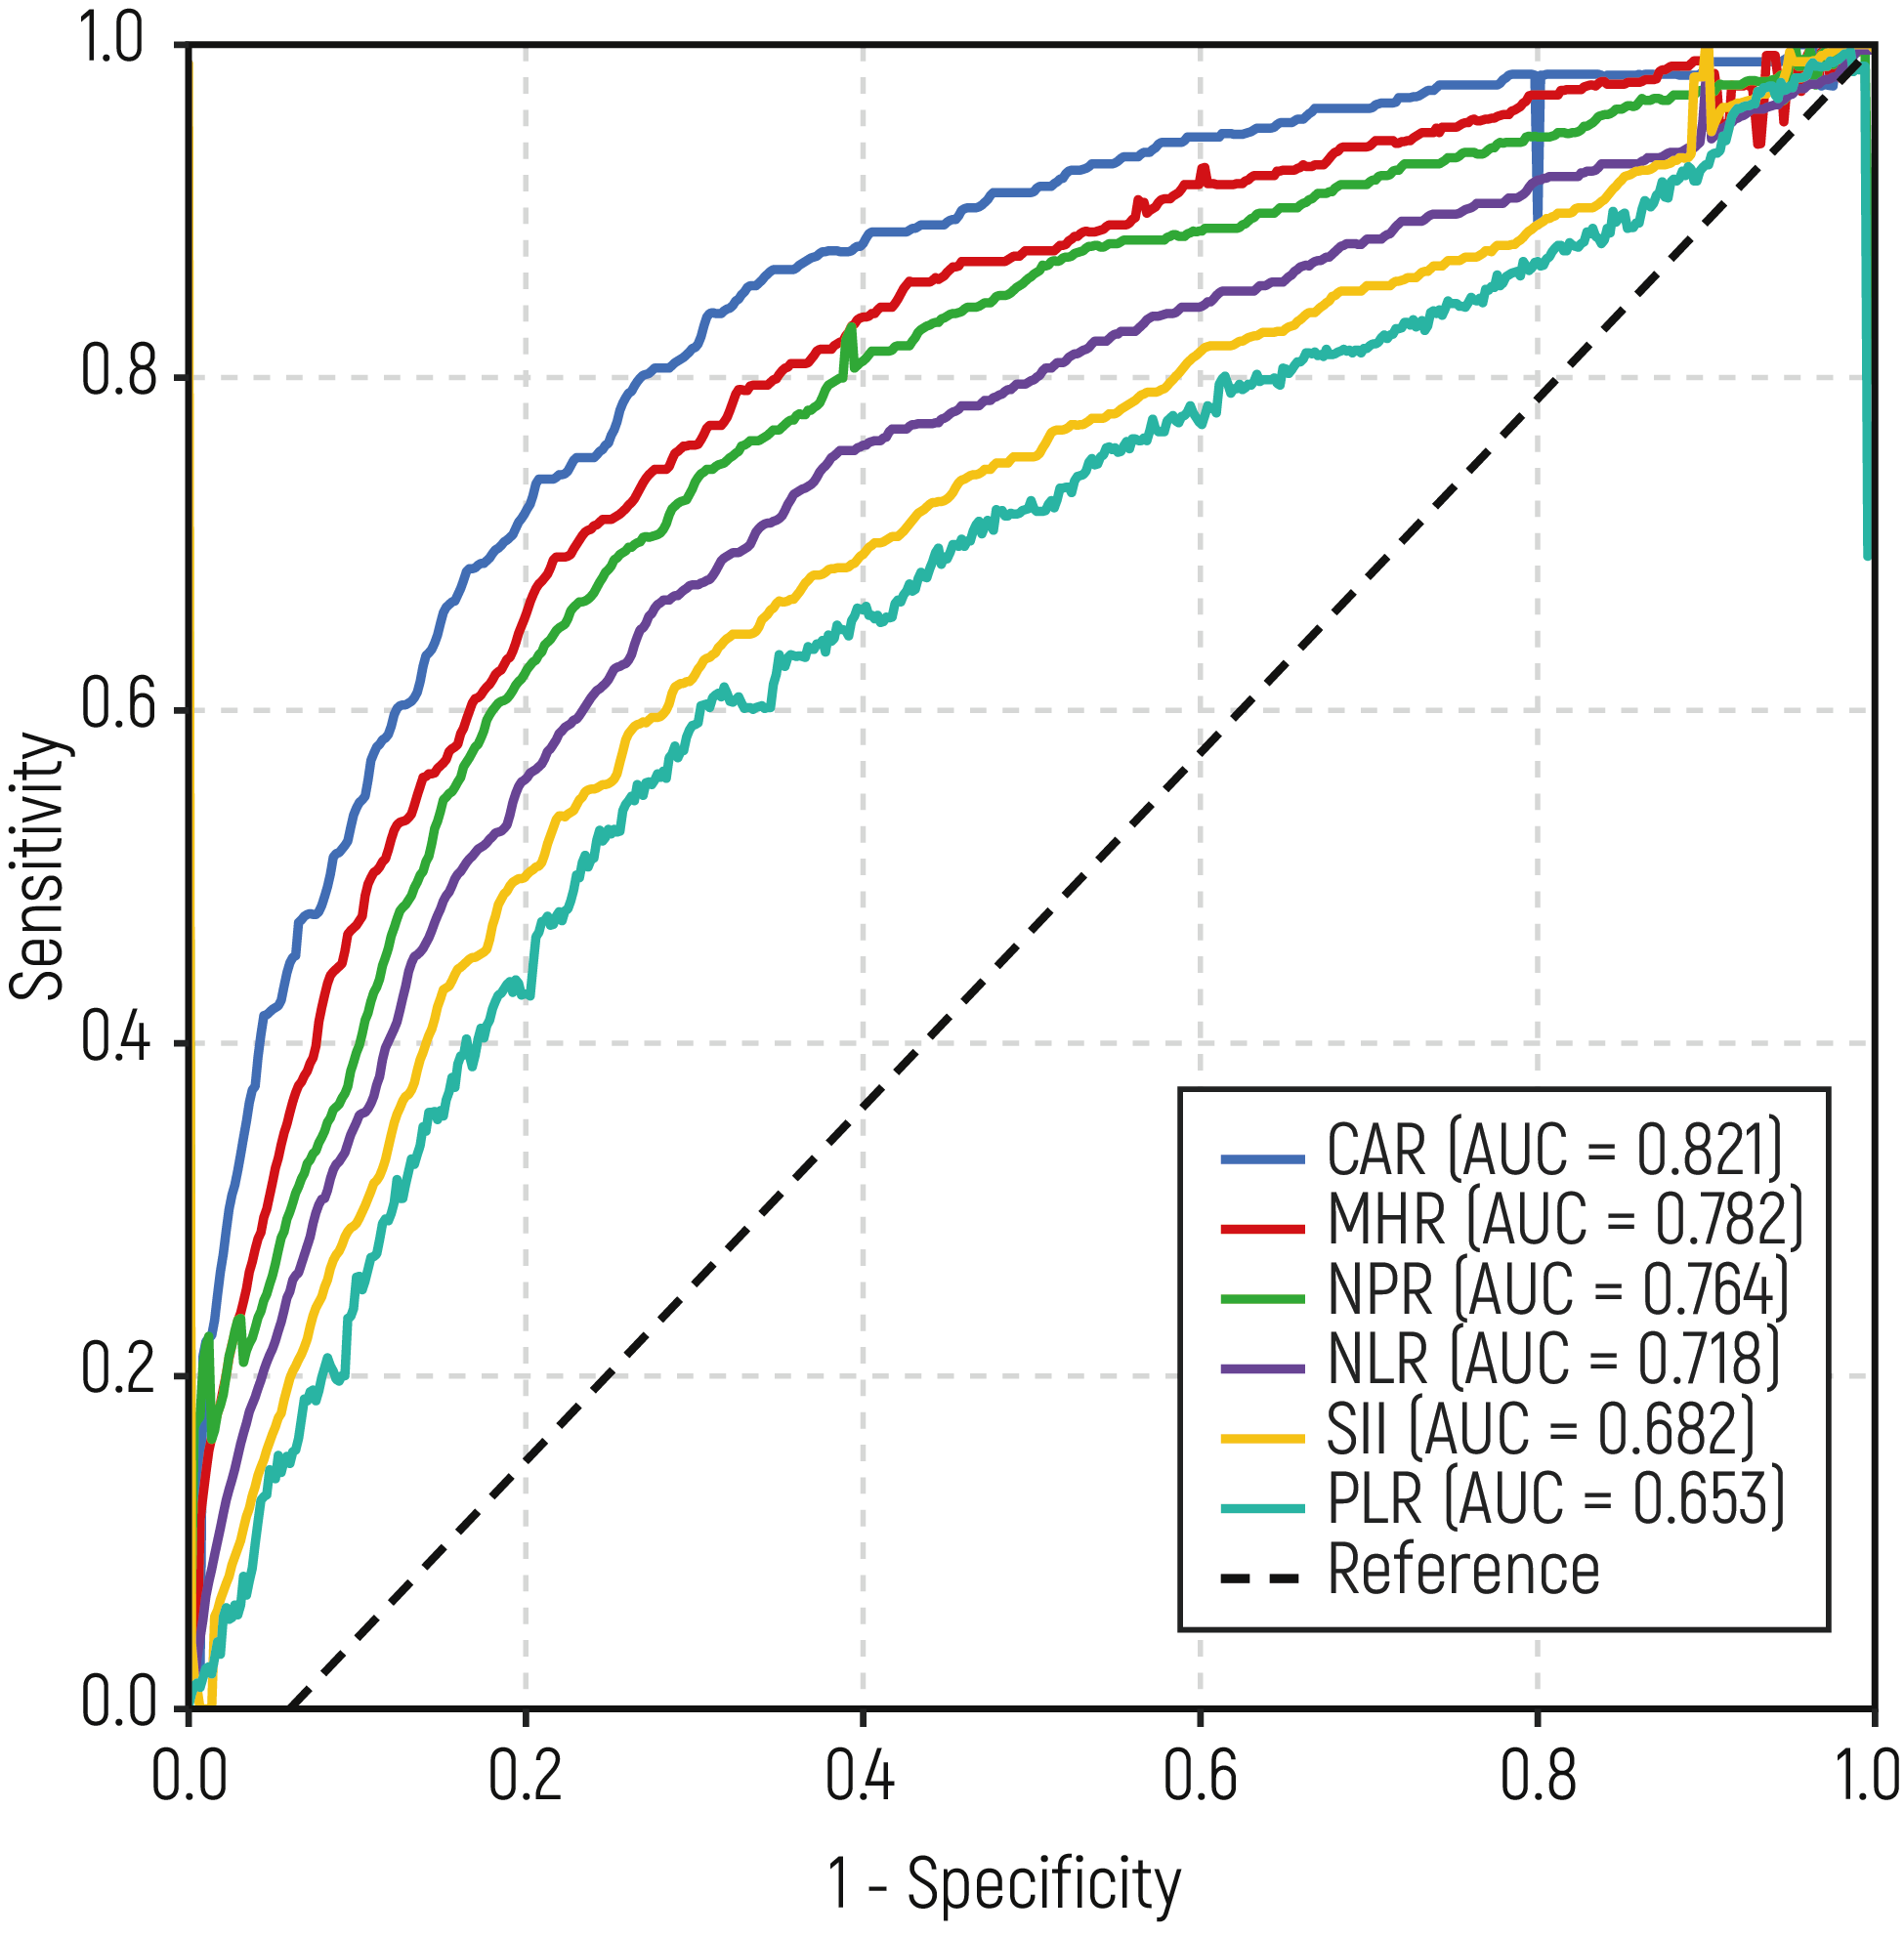
Figure 3. ROC curves for prediction of TRAb positivity.
Additional Information
Publisher’s Note
Bayrakol MP remains neutral with regard to jurisdictional and institutional claims.
Rights and Permissions

This work is licensed under a Creative Commons Attribution-NonCommercial 4.0 International License (CC BY-NC 4.0). To view a copy of the license, visit https://creativecommons.org/licenses/by-nc/4.0/
About This Article
How to Cite This Article
Sadettin Ozturk. Comprehensive evaluation of hematological inflammatory indices as biomarkers of autoimmune activity in Graves’ disease: associations with TRAb and disease activity. Eu Clin Anal Med 2026;14(3):77-84. doi:10.4328/ECAM.25027
- Received:
- 21.07.2026
- Accepted:
- 22.08.2026
- Published Online:
- 25.08.2026
- Printed:
- 01.09.2026