Abstract
AimGamma-glutamyltransferase (GGT) and high density lipoprotein (HDL) have roles in fatty liver, atherosclerosis, oxidative stress, diabetes, and insulin resistance. This study’s aim was to examine the predictive value of GGT/HDL ratio and of triglyceride/HDL ratio for patients with type II diabetes mellitus (T2DM) and to evaluate their diagnostic efficacy.As far as we know, this is the first study examining the utility of GGT/HDL ratio in type II diabetes mellitus, its predictive value and its diagnostic efficacy.MethodsA total of 90 people with similar demographic characteristics, including 60 patients with T2DM and a control group consisting of 30 individuals, were included in this study. Age, sex, fasting serum glucose, total cholesterol, triglycerides, HDL, LDL, GGT, fasting serum insulin, HbA1c, uric acid, C-reactive protein, triglycerides/HDL ratio, GGT/HDL ratio and uric acid/HDL ratio levels were evaluated within the scope of the study.ResultsA difference in TAG/HDL ratio between the patient and control groups was found (p=0.005). A significant difference was found in GGT/HDL ratio between the patient and control groups (p=0.021). Positive correlations were found between TAG/HDL ratio and HbA1c and between TAG/HDL ratio and glucose in the patient and control groups (rho: 0.251, p:0.018; rho: 0.349, p< 0.001, respectively). Positive correlations were found between GGT/HDL ratio and HbA1c and GGT/HDL ratio and glucose (rho: 0.252, p<0.017; rho: 0.371, p<0.001, respectively). According to the ROC analysis, the AUC results were as follows: AUC: 0.682 for triglyceride/HDL ratio and AUC: 0.651 for GGT/HDL ratio.ConclusionIn conclusion, there were significant associations between GGT/HDL and diabetes and between triglycerides/HDL and diabetes in type 2 diabetic patients. The GGT/HDL ratio was found to have a positive correlation with HbA1c and glucose. Both indices may have high discriminatory power to predict the patients with T2DM (AUC of TAG/HDL: 0.682 and AUC of GGT/HDL: 0.651). However, prospective studies with more subjects are required for validation purposes. As far as we know, this is the first study describing the usefulness of GGT/HDL ratio in type II diabetes mellitus, its predictive value and its diagnostic efficacy.
Keywords
Introduction
Today, according to the World Health Organization data, diabetes mellitus affects 422 million people worldwide. According to the Global Report on Diabetes, the prevalence of diabetes was 4.7% in 1980 and in 2014 it was 8.5%. Also, it was predicted that the number of diabetic patients will reach 642 million by 2040. Approximately 95% of the diabetes cases are type II diabetes mellitus (T2DM) patients and this results in the death of millions of people each year.1-2 Diabetes is characterized by high blood sugar and is one of the leading causes of death. Diabetes disease is a strong risk factor and chronic metabolic disease that includes a wide range of other diseases such as end-stage renal disease, atherosclerosis, neuropathy, retinopathy, cardiovascular diseases, limb amputation, increased fetal mortality, preeclampsia, and cerebrovascular stroke.1,3-4 Behavioral risk factors such as physical inactivity and unhealthy diet, along with changing lifestyles, have led to an increase in metabolic risk factors closely related to diabetes. The increase in most metabolic risk factors such as obesity, hyperlipidemia, and insulin resistance leads to cardiovascular diseases and T2DM, and then, to related complications over time.4 The way to prevent diabetes, diagnose it earlier and keep it under control is to reduce high blood sugar levels, reduce behavioral and metabolic risk factors and follow up these.Therefore, tests such as glycosylated hemoglobin (HbA1c), oral glucose tolerance test (OGTT), fasting blood glucose, and lipid parameters are vital for preventing the progression of metabolic risk factors such as obesity, hyperlipidemia, insulin resistance to T2DM and for early diagnosis.1-2,5 Today, HbA1c is accepted as the best indicator for the diagnosis and follow-up of diabetic control. HbA1c reflects average blood glucose levels over a period of approximately 120 days. High HbA1c level is correlated with poor glycemic control and a strong risk of complications.5 Although HbA1c is an ideal test for the diagnosis and follow-up of type II diabetes mellitus, it cannot reflect daily or recent glucose regulation.5 However, it has disadvantages such as high cost and not being required routinely.6 It has been shown that proportional parameters such as triacylglycerides/high-density lipoprotein (TAG/HDL), uric acid/HDL, gamma-glutamyltransfrase (GGT)/HDL, which are used in studies conducted in recent years, and their associations in metabolic syndrome, atherosclerosis, non-alcoholic fatty liver disease (NAFLD), insulin resistance, T2DM diseases have predictive and diagnostic value.7-8 It has been accepted that uric acid/HDL-C is the best predictor for NAFLD, and the TAG/HDL-C ratio is a good predictor of renal dysfunction.7,9 The association of GGT and HDL with diabetes, insulin resistance, obesity, cardiovascular risk, and oxidative stress is commonly known today.10 High triglycerides and decreased HDL levels are considered one of the indicators of metabolic syndrome. It is also known that HDL has antioxidant and antithrombotic characteristics and is associated with various metabolic disorders.7 GGT, HDL, and triglycerides parameters, which are routinely measured in all healthcare facilities and are inexpensive to measure, are closely associated with obesity, metabolic syndrome, lipidemia, and diabetes.10 However, the correlation between GGT/HDL ratio and HbA1c for patients with T2DM, its predictive value and diagnostic efficacy have not been examined. These indices may have potential use for the screening of patients with diabetes and poor glycemic control.The objective of this paper is to examine the predictive value of GGT/HDL ratio and TAG/HDL ratio for patients with T2DM and to evaluate its diagnostic efficacy.
Materials and Methods
A total of 90 people with similar demographic characteristics, including 60 patients with T2DM and a control group consisting of 30 healthy volunteers, were included in this study. The permission for the study was granted by Mugla Sıtkı Kocman University Research and Training Hospital (decision: 2022/20) in accordance with the provisions of the Declaration of Helsinki.
The patient group consisted of patients with T2DM diagnosis who had HbA1c values above 6.5%, aged between 18-65 years, without infective diseases, had no viral hepatitis history, without any acute-chronic hepatitis, and liver or other organ failures. Patients with a history of surgery, cholestasis, thyroid dysfunction, and chemotherapy were excluded from the study. The control group included healthy subjects with demographic characteristics similar to the patients. Glucose, GGT, HDL, total cholesterol, triglycerides, and uric acid levels were measured using the enzymatic and spectrophotometric methods on an Advia 1800 analyzer (Siemens Diagnostics, Germany). Insulin levels were measured on an XPT analyzer (Siemens Diagnostics, Germany) using the chemiluminescent method. HbA1c levels were measured by high pressure liquid chromatography (HPLC) using an ADAMS A1c HA8180V analyzer (Arkray, Japan).Statistical AnalysisAll the statistical analyzes were performed using Jamovi (version 1.6.23). The Shapiro-Wilk test was used to assess the conformity of the variables to the normal distribution. Since the variables of the groups were not normally distributed, the group differences were evaluated using the Mann-Whitney U test. Spearman’s correlation coefficients were calculated to determine the associations between continuous variables. Binomial logistic regression was used to predict the presence of type 2 diabetes using GGT/HDL ratio. ROC curve analysis was performed to evaluate the binomial classification performance of the GGT/HDL ratio. For all statistical tests, P-values ≤ 0.05 were considered significant.
Results
Table 1 shows the demographic data about patient and control groups.A statistically significant difference was found for TAG/HDL ratio between the patients and the control group (p=0.005) (Table 2).
A significant difference was found for GGT and GGT/HDL ratio between the patients and the control group (p=0.025, p=0.021, respectively).
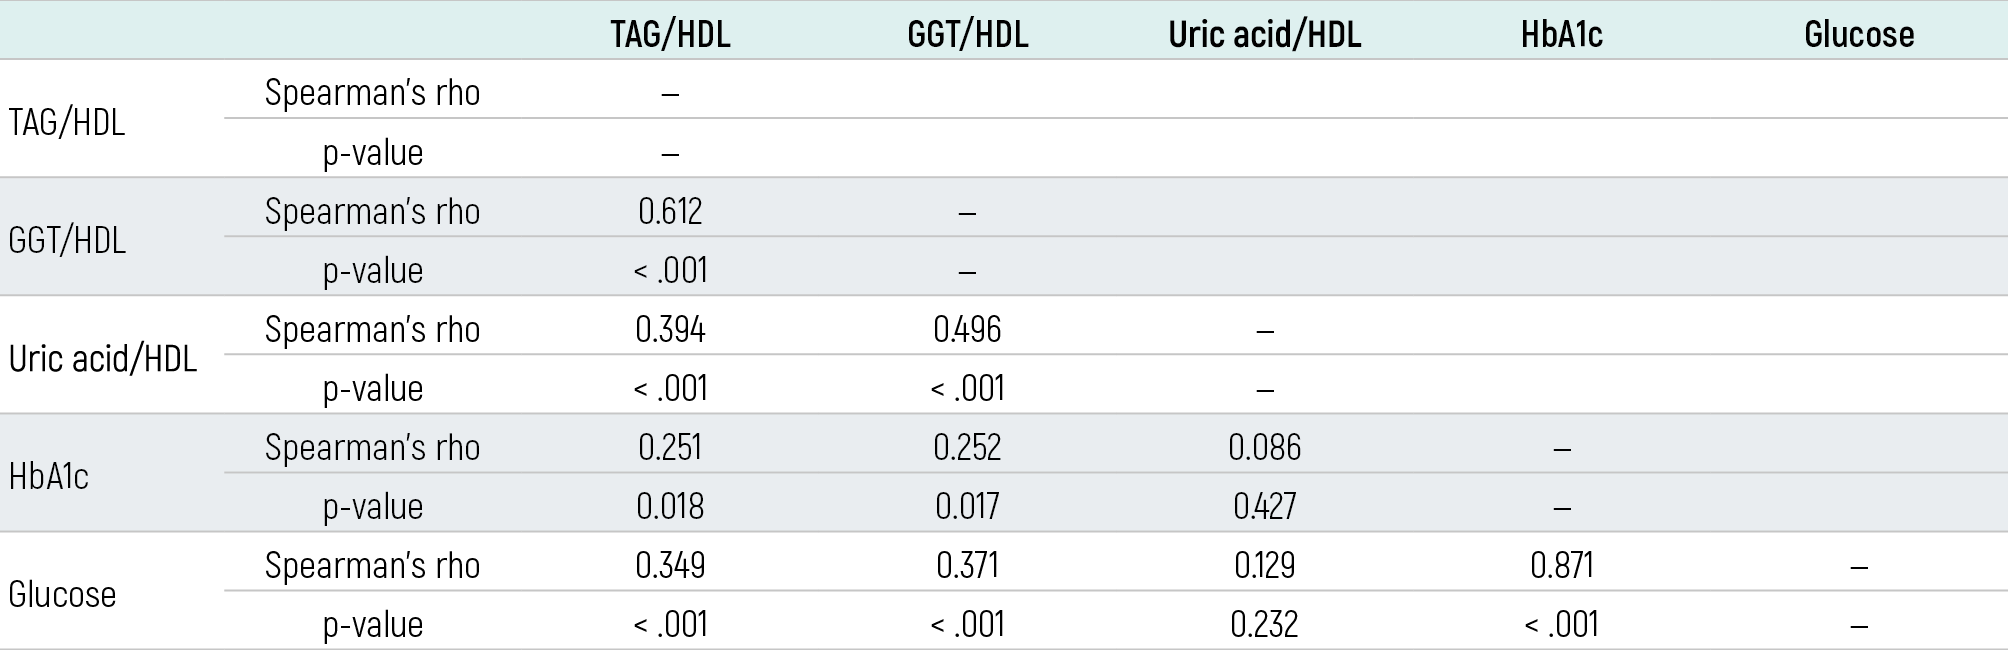
A positive correlation was found between TAG/HDL ratio and HbA1c as well as between TAG/HDL and glucose (Table 3) (rho: 0.251, p=0.018; rho=0.349, p<0.001, respectively). A positive correlation was found between GGT/HDL ratio and HbA1c as well as between GGT/HDL ratio and glucose (rho: 0.252, p< 0.017; rho: 0.371, p<0.001, respectively).
For the ROC analysis with a cut-off value of 0.52 Figure 1, the TAG/HDL-C index had a sensitivity of 35.59% (Figure 2) and a specificity of 93.3% in predicting diabetes. With a cut-off value of 0.52, the GGT/HDL-C ratio had a sensitivity of.
Discussion
This study examines the associations between GGT/HDL ratio, TAG/HDL ratio, and T2DM in an adult population with type 2 diabetes. As far as we know, this is the first study describing the utility of GGT/HDL ratio in type II diabetes mellitus, its predictive value and diagnostic efficacy.Gamma-glutamyltransferase - high-density lipoprotein cholesterol ratio (GGT/HDL) is a new index. Accumulated data from epidemiological studies in recent years show that GGT can be used as an indicator for diseases such as fatty liver, atherosclerosis, diabetes, and insulin resistance. GGT is a transmembrane protein that has protective properties against oxidative stress and provides amino acid transfer from the extracellular environment. It is also a soluble protein that can increase insulin resistance and reduce the risk of metabolic syndrome and other chronic diseases.10-11 It is also known to have antioxidant and antithrombotic characteristics and is associated with various metabolic disorders.HDL is a lipoprotein which has anti-inflammatory and antioxidant properties. Low levels are observed in cases of type 2 diabetes and of metabolic syndrome.10,12 In the study by Feng et al., the associations between GGT/HDL ratio and metabolic syndrome as well as non-alcoholic fatty liver disease were examined, and researchers reported that the GGT/HDL index had a predictive value for NAFLD patients.13 T2DM, NAFLD, and metabolic syndrome share similar risk factors and similar pathogenesis.14 These have common dyslipidemic properties.12-13 The data we obtained in our study suggest that there is a positive and significant correlation between GGT/HDL and HbA1c and between GGT/HDL glucose in type 2 diabetes. The possible reason for this may be that increased oxidative stress increases intracellular GGT levels, which can be considered a biomarker for GSH metabolis.15-16 According to our findings from this study, higher levels of GGT/HDL-C and TAG/HDL are positively correlated with HbA1c and glucose levels. However, according to the results of the ROC curve analysis, both ratios have a weak discrimination power in the prediction of type 2 diabetes (TAG/HDL AUC: 0.682 and GGT/HDL AUC: 0.651) (Figure 3).Various previous studies have shown that increased TAG/HDL ratio is a better indicator than other lipid parameters for metabolic syndrome, diabetes, atherosclerosis, cardiovascular disease, and insulin resistance.3-4,17 A previous study revealed that the presence of increased TAG/HDL level is associated with an increase in HbA1c. The link between high TAG/HDL and poor diabetic control has been confirmed by clinical studies as well.18-19 In the study of Giannini et al., an association was found between TAG/HDL ratio and insulin resistance in young patients with childhood obesity. It was reported that the TAG/HDL index could be used effectively in differentiating individuals with high morbidity.8 Lin et al. reported that there was a correlation between TAG/HDL ratio and insulin resistance, HbA1c, OGTT in the Chinese population of 9764 people and that they obtained a better diagnostic value.17 Another study examined the correlation between TAG/HDL ratio and insulin resistance, beta cell function in the Hispanic population. According to the results obtained, TAG/HDL index was found to be successful in predicting insulin resistance for patients with atherosclerosis and predicting diabetes for women.20 In our current study, in line with the results of other studies mentioned above, TAG/HDL ratio was found to be higher for diabetic patients compared to the normoglycemic control group. In this study, both TAG/HDL and GGT/HDL ratios were examined. These ratios were found to have insufficient specificity and sensitivity to detect diabetes. In the ROC curve analysis, the TAG/HDL had a greater AUC value to identify T2DM patients. One of the possible reasons for this may be the relatively small size of our sample group. In addition, the exercise and diet habitsof our patients were unknown to us. High HDL may alter the effects of hypertriglyceridemia on liver cells.21
Limitations
Our sample group was relatively small and information about the exercise habits, obesity status and nutritional habits of our patients could not be reached for the study.
Conclusion
In conclusion, there were significant associations between GGT/HDL and diabetes and between triglycerides/HDL and diabetes in type 2 diabetic patients. The GGT/HDL ratio was found to have a positive correlation with HbA1c and glucose. Both indices may have high discriminatory power to predict diabetes for patients with T2DM (TAG/HDL-C AUC: 0.682 and GGT/HDL-C AUC: 0.651). To understand their true potentials, prospective studies with more subjects are required.Lastly, to the best of our knowledge, this is the first study describing the association between GGT/HDL ratio and type II diabetes mellitus, its predictive value and diagnostic efficacy.
Declarations
Informed Consent
Written informed consent was obtained from all participants included in the study.
Data Availability
The data supporting the findings of this study are available from the corresponding author upon reasonable request.
Conflict of Interest
The authors declare no conflict of interest.
Funding
None.
Abbreviations
AUC: Area under the curve
GGT: Gamma-glutamyl transferase
HbA1c: Hemoglobin A1c
HDL: High-density lipoprotein
HPLC: High-performance liquid chromatography
LDL: Low-density lipoprotein
NAFLD: Non-alcoholic fatty liver disease
OGTT: Oral glucose tolerance test
ROC: Receiver operating characteristic
TAG: Triacylglyceride
T2DM: Type 2 diabetes mellitus
References
- Roglic G. WHO global report on diabetes: a summary. Int J Noncommunicable Dis. 2016;1(1):3. doi:10.4103/2468-8827.184853
- Bommer C, Sagalova V, Heesemann E, Manne-Goehler J, Atun R, Bärnighausen T, et al. Global economic burden of diabetes in adults: projections from 2015 to 2030. Diabetes Care. 2018;41(5):963-970. doi:10.2337/dc17-1962
- Chen Z, Chen G, Qin H, Cai Z, Huang J, Chen H, et al. Higher triglyceride to high-density lipoprotein cholesterol ratio increases cardiovascular risk: 10-year prospective study in a cohort of Chinese adults. J Diabetes Investig. 2020;11(2):475-481. doi:10.1111/jdi.13118
- Yunke Z, Guoping L, Zhenyue C. Triglyceride-to-HDL cholesterol ratio. Springer; 2014. doi:10.1007/s00059-013-3788-0
- Weykamp C. HbA1c: a review of analytical and clinical aspects. Ann Lab Med. 2013;33(6):393-400. doi:10.3343/alm.2013.33.6.393
- Bennett C, Guo M, Dharmage S. HbA1c as a screening tool for detection of type 2 diabetes: a systematic review. Diabet Med. 2007;24(4):333-343. doi:10.1111/j.1464-5491.2007.02106.x
- Iwani NAKZ, Jalaludin MY, Wan Mohd Zin RM, Fuziah Z, Hua Hong JY, Abqariyah Y, et al. Triglyceride to HDL-C ratio is associated with insulin resistance in overweight and obese children. Sci Rep. 2017;7(1):1-7.
- Giannini C, Santoro N, Caprio S, Kim G, Lartaud D, Shaw M, et al. The triglyceride-to-HDL cholesterol ratio: association with insulin resistance in obese youths of different ethnic backgrounds. Diabetes Care. 2011;34(8):1869-1874. doi:10.2337/dc10-2234
- Xue J, Wang Y, Li B, Yu S, Wang A, Wang W, et al. Triglycerides to high-density lipoprotein cholesterol ratio is superior to triglycerides and other lipid ratios as an indicator of increased urinary albumin-to-creatinine ratio in the general population of China: a cross-sectional study. Lipids Health Dis. 2021;20(1):1-12.
- Ndrepepa G, Colleran R, Kastrati A. Gamma-glutamyl transferase and the risk of atherosclerosis and coronary heart disease. Clin Chim Acta. 2018;476:130-138. doi:10.1016/j.cca.2017.11.026
- Lieberman MW, Barrios R, Carter BZ, Habib GM, Lebovitz RM, Rajagopalan S, et al. Gamma-glutamyl transpeptidase: what does the organization and expression of a multipromoter gene tell us about its functions? Am J Pathol. 1995;147(5):1175-1185.
- Sumner AE, Finley KB, Genovese DJ, Criqui MH, Boston RC. Fasting triglyceride and the triglyceride–HDL cholesterol ratio are not markers of insulin resistance in African Americans. Arch Intern Med. 2005;165(12):1395-1400. doi:10.1001/archinte.165.12.1395
- Feng G, Feng L, Zhao Y. Association between ratio of gamma-glutamyl transpeptidase to high-density lipoprotein cholesterol and prevalence of nonalcoholic fatty liver disease and metabolic syndrome: a cross-sectional study. Ann Transl Med. 2020;8(10):634. doi:10.21037/atm-19-4516
- Preuss HG, Kaats GR, Mrvichin N, Swaroop A, Bagchi D, Clouatre D, et al. Examining the relationship between nonalcoholic fatty liver disease and the metabolic syndrome in nondiabetic subjects. J Am Coll Nutr. 2018;37(6):457-465. doi:10.1080/07315724.2018.1443292
- Wang P, Zhang J, Liu HW, Hu XX, Feng LL, Yin X, et al. An efficient two-photon fluorescent probe for measuring gamma-glutamyl transpeptidase activity during the oxidative stress process in tumor cells and tissues. Analyst. 2017;142(10):1813-1820. doi:10.1039/c7an00229g
- Karp DR, Shimooku K, Lipsky PE. Expression of gamma-glutamyl transpeptidase protects Ramos B cells from oxidation-induced cell death. J Biol Chem. 2001;276(6):3798-3804. doi:10.1074/jbc.m008484200
- Lin D, Qi Y, Huang C, Wu M, Wang C, Li F, et al. Associations of lipid parameters with insulin resistance and diabetes: a population-based study. Clin Nutr. 2018;37(4):1423-1429. doi:10.1016/j.clnu.2017.06.018
- Quispe R, Martin SS, Jones SR. Triglycerides to high-density lipoprotein–cholesterol ratio, glycemic control and cardiovascular risk in obese patients with type 2 diabetes. Curr Opin Endocrinol Diabetes Obes. 2016;23(2):150-156. doi:10.1097/med.0000000000000241
- Babic N, Valjevac A, Zaciragic A, Avdagic N, Zukic S, Hasic S. The triglyceride/HDL ratio and triglyceride glucose index as predictors of glycemic control in patients with diabetes mellitus type 2. Med Arch. 2019;73(3):163. doi:10.5455/medarh.2019.73.163-168
- Young KA, Maturu A, Lorenzo C, Langefeld CD, Wagenknecht LE, Chen YDI, et al. The triglyceride to high-density lipoprotein cholesterol ratio (TG/HDL-C) as a predictor of insulin resistance, beta-cell function, and diabetes in Hispanics and African Americans. J Diabetes Complications. 2019;33(2):118-122. doi:10.1016/j.jdiacomp.2018.10.018
- Ferrier DR. Lippincott’s illustrated reviews. Lippincott Williams & Wilkins; 2014
Tables
Table 1. Demographic Characteristics of the Patients with Type II Diabetes and Healthy Controls
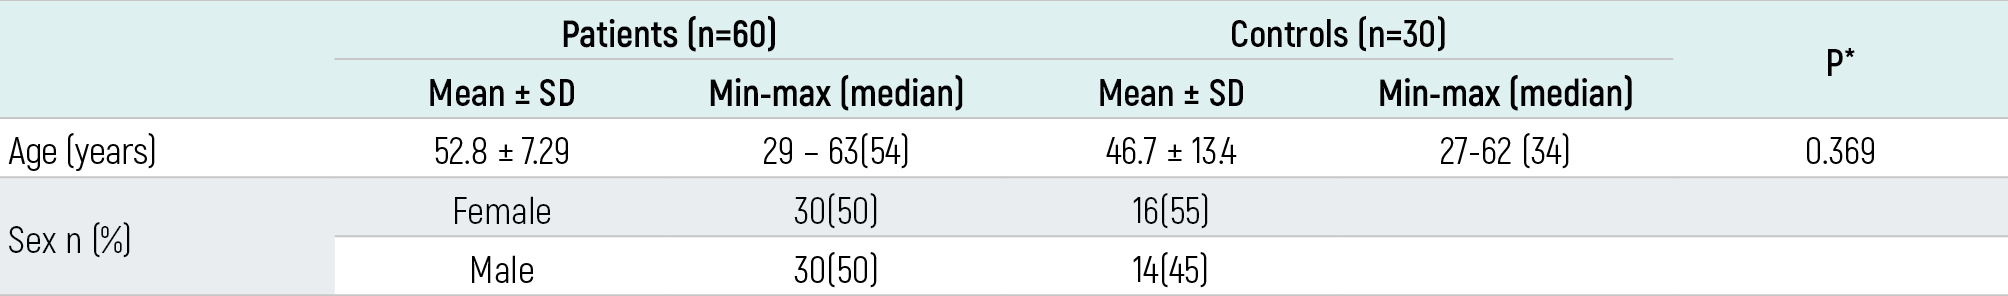
Table 2. Blood chemistry variables of the patient and the control groups
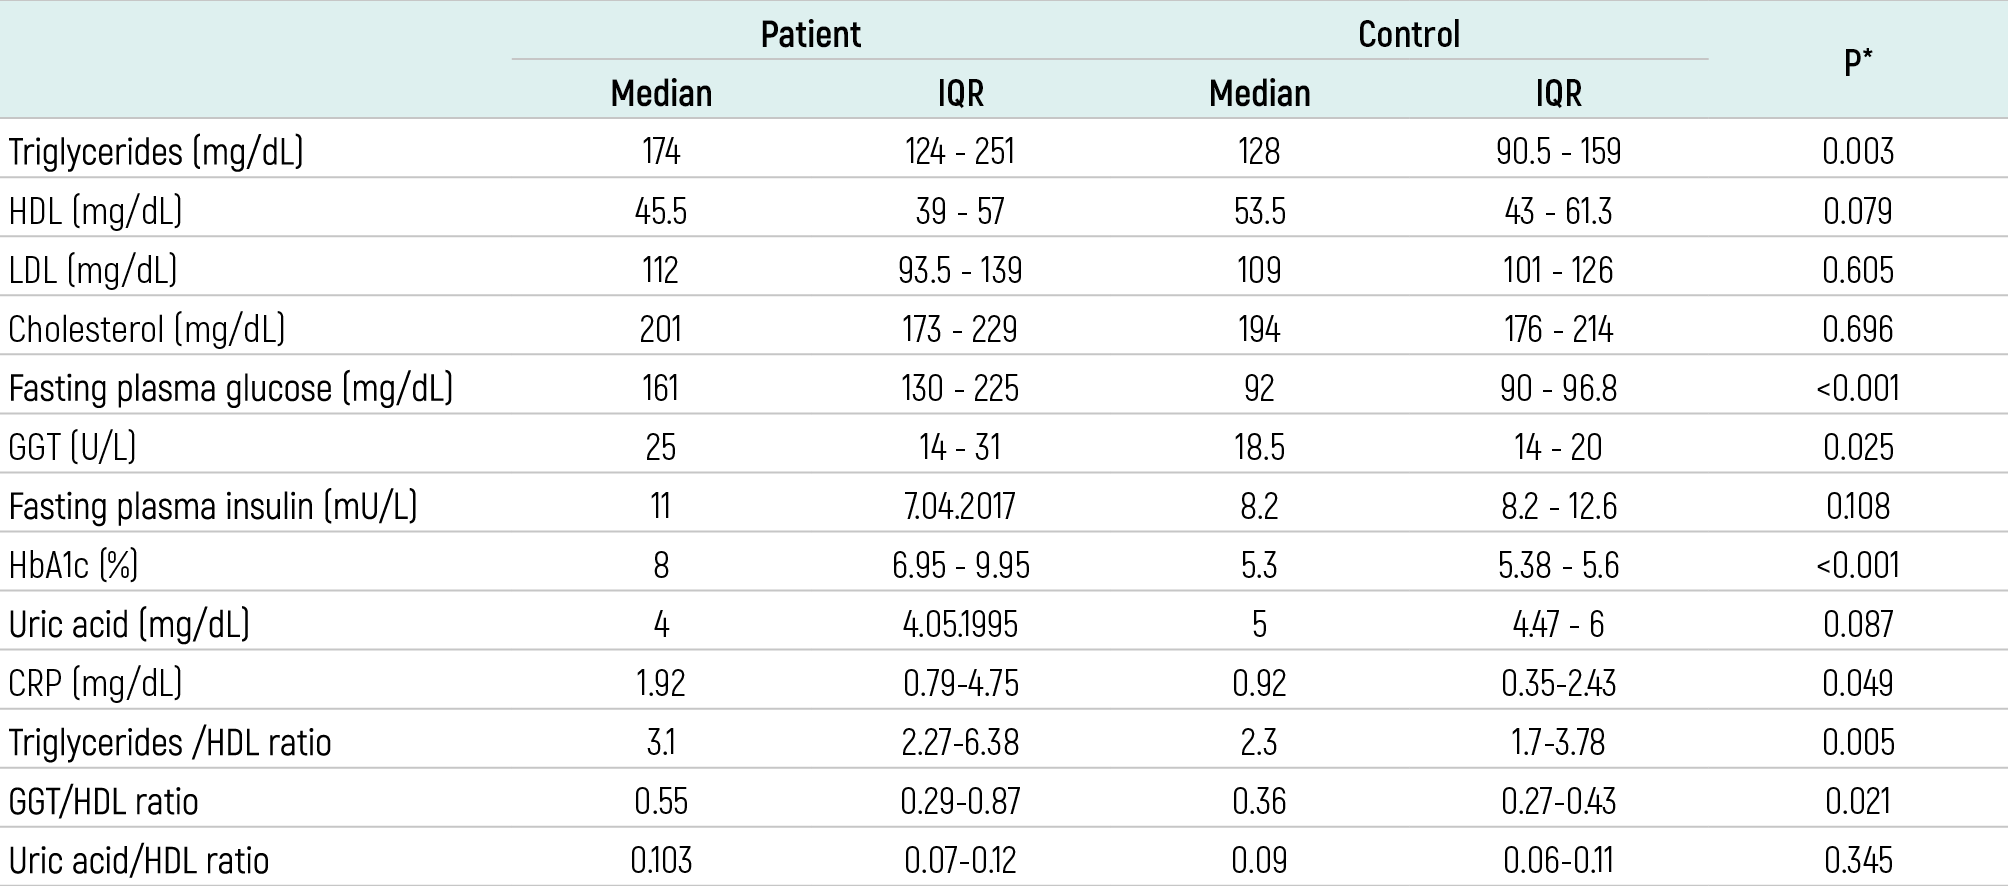
Table 3. Correlation matrix between GGT/HDL, TAG/HDL ratios and other variables
Figures
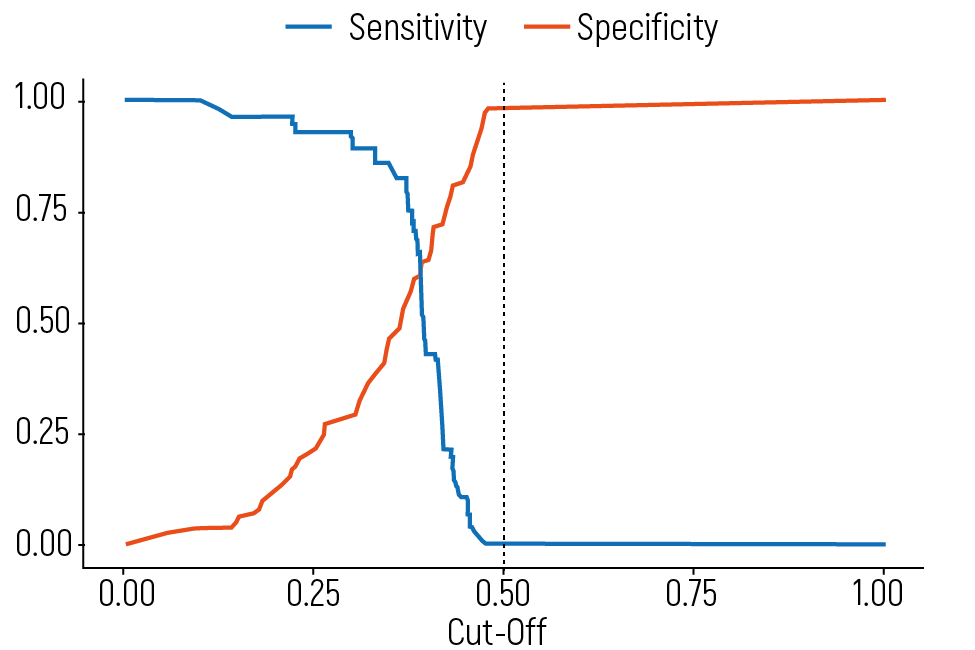
Figure 1. GGT/HDL Ratio Cut-off Plot
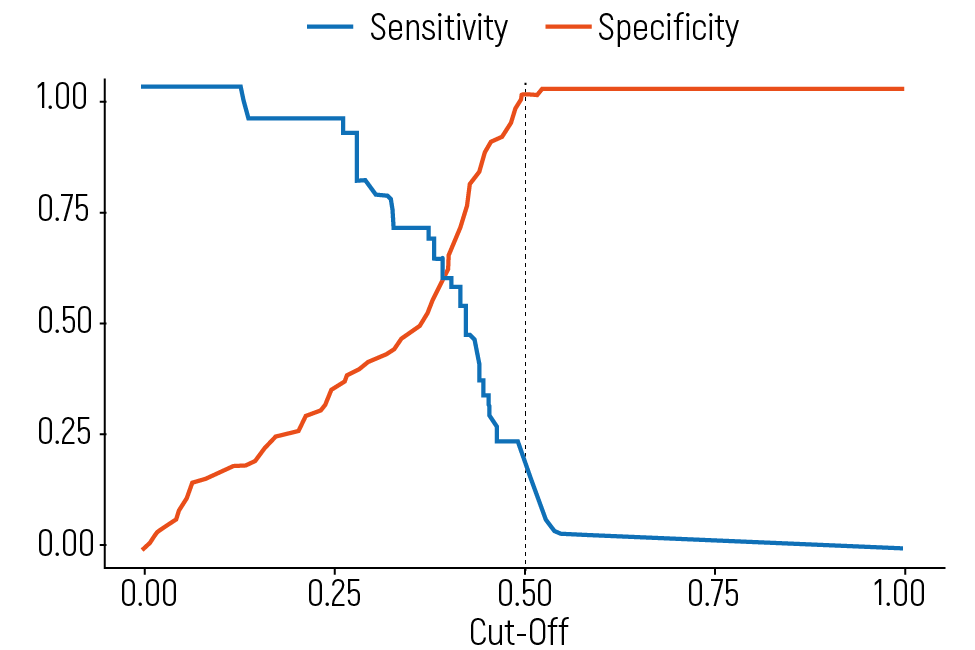
Figure 2. TAG/HDL Ratio Cut-off Plot (TAG/HDL AUC: 0.682, %95 CI ve GGT/HDL AUC: 0.651, %95 CI)
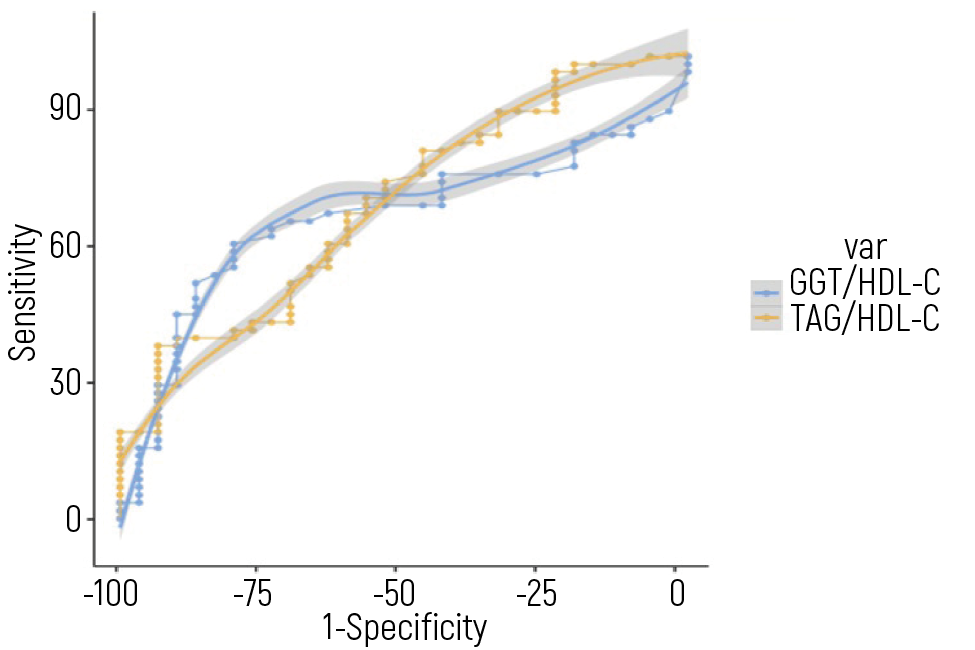
Figure 3. TAG/HDL Ratio and GGT/HDL Ratio ROC Curves
Additional Information
Publisher’s Note
Bayrakol MP remains neutral with regard to jurisdictional and institutional claims.
Rights and Permissions
This work is licensed under a Creative Commons Attribution-NonCommercial 4.0 International License (CC BY-NC 4.0). To view a copy of the license, visit https://creativecommons.org/licenses/by-nc/4.0/
About This Article
How to Cite This Article
Süheyl Uçucu, Talha Karabıyık, Dilek Gibyeli Genek. The GGT / HDL ratio is positively correlated with hemoglobin A1c in the population with type II diabetes mellitus. Eu Clin Anal Med 2026;10(3):17-21. doi:10.4328/ECAM.10035
- Received:
- 24.02.2022
- Accepted:
- 09.05.2022
- Published Online:
- 17.05.2022
- Printed:
- 01.09.2022