Comparison of patellar height measurements using three different imaging modalities
Patellar height
Authors
Abstract
Aim To evaluate whether the universally accepted normal ranges of patellar height ratios established on radiographs using the Insall-Salvati (IS) and Blackburne-Peel (BP) methods can be reliably applied to computed tomography (CT) and magnetic resonance imaging (MRI) assessments.
Methods A total of 90 knees from 84 patients (30 men, 54 women; age range, 18–68 years; mean age, 40 ± 19 years) who underwent three different imaging modalities, radiography (X-ray), CT, and MRI, were included in the study. Knee imaging had been performed for various clinical indications. Patellar height measurements were conducted by two independent observers, each blinded to the other’s measurements and the corresponding measurements from the other imaging modalities.
Results There were small but statistically significant differences in patellar height ratios among X-ray, CT, and MRI. To achieve comparable results with the IS method, an adjustment of +0.12 for MRI and +0.09 for CT is required relative to X-ray measurements. For the BP ratio, a correction of +0.08 is needed when comparing MRI to X-ray, whereas no adjustment is necessary between X-ray and CT. Notably, these adjustments were found to be independent of patient gender. Inter-observer reproducibility was excellent across all imaging modalities for both the IS and BP methods, with intraclass correlation coefficients (ICC) ≥ 0.92.
Conclusion While radiographic thresholds for patella alta and baja require slight adjustments when applied to CT and MRI, patellar height measurements remain highly reproducible across all imaging modalities.
Keywords
Introduction
The patellofemoral joint is highly dynamic, and its pathologies can account for a significant proportion of the symptoms that occur in the knee joint. Both the atypical anatomical structure of this joint and its easily vulnerable cartilage often cause symptoms that can result in pain in the anterior region of the knee, and these symptoms are a common condition affecting the general population, especially those with a physically active lifestyle.1 Patients presenting with anterior knee pain or patellofemoral syndrome are frequently evaluated using radiographic and cross-sectional imaging, based on a preliminary suspicion of abnormal patellar positioning or other knee pathologies, in accordance with a standard diagnostic algorithm. Patellar malalignment, such as a higher than normal patella (patella alta) or a lower than normal patella (patella baja), can lead to progressive cartilage damage and functional problems in the patellofemoral joint, or even disability resulting in joint disability. Although accepted standard reference values and ratios for measuring patellar height are available in the literature for radiographs, some recent studies have used magnetic resonance imaging (MRI) to specifically measure patellar tendon length because of its ability to show the patellar tendon and other associated anatomical complexes in three dimensions.2 The assessment of patellar tendon length on MRI offers greater reliability than on radiographs, thanks to its superior soft tissue contrast and its ability to provide cross-sectional views. This enhancement not only improves the detection of patellar instability but also allows for a more comprehensive evaluation of soft tissue abnormalities associated with internal derangements.2,3,4 Nonetheless, while standard reference values exist for patellar height ratios on radiographs, there remains a lack of consensus regarding the normal range for patellar height on computed tomography (CT) and MRI. Considering that many patients with knee complaints often undergo MRI or CT imaging alongside radiography—and that radiographs might not always be accessible during cross-sectional imaging it becomes essential to clarify how patellar height measurements correspond across different imaging modalities. Establishing standardized measurement techniques for patellar height across different imaging modalities and understanding the systematic differences between them may enhance the accuracy of diagnosing patellar height abnormalities. Furthermore, given the variability in reported diagnostic thresholds for patella alta, understanding how these ratios translate across different imaging methods is vital.5,6 This would enable a more consistent diagnosis of patella alta on MRI and CT, similar to radiographs. Numerous techniques exist to evaluate patellar height, most of which were originally designed for radiographs.4,5,6,7,8,9,10 The Insall Salvati (IS) and Blackburne–Peel (BP) measurement ratios are well-established reference standards for evaluating patellar height in the existing literature.11,12 These methodologies formed the foundation for our research, paralleling the tri-modality imaging study conducted by Lee et al.13
In this study, we analyzed the commonly used Insall–Salvati (IS) and Blackburne–Peel (BP) methods to compare patellar height measurements across different imaging modalities. The primary objective was to evaluate whether the standard reference ranges for normal patellar height, established on radiographs using the IS and BP methods, could be reliably applied to computed tomography (CT) and magnetic resonance imaging (MRI). In addition, interobserver variability was assessed.
Materials and Methods
Study Design and DopulationMedical images were retrospectively retrieved from the hospital’s imaging system in the radiology department by reviewing knee radiographs, CT, and MRI studies acquired between January 2019 and April 2025.
Inclusion criteria included: age ≥ 18 years and the availability of CT, MRI, and radiography of the same knee. A total of 122 knees from 98 patients initially met these criteria. However, 32 knees from 19 patients were excluded due to poor image quality, prior trauma/surgery, or prosthetic implants. The final study population included 90 knees (30 right, 60 left) from 84 patients (30 males, 54 females; age range 18–68 years; mean age 40 ± 19 years).
Image AcquisitionPatellar height ratios were assessed using standard lateral knee radiographs. Although all lateral radiographs were performed with patients in a standing position, the exact proportion of cases that may have deviated from the standardized protocol could not be determined due to the retrospective design of this study. Knee MRI studies were obtained from two scanners, both General Electric (GE) scanners, Signa HDxt and Signa Explorer models with 1.5 Tesla (T) capability. All measurements were taken from mid-sagittal fat-saturated T2- weighted proton density sequences. CT images were obtained from Optima CT66 and REVOLUTION EVO3.7 model devices, both GE brand and 128 slices. The study was obtained from sagittal plan reformatted images.
Image InterpretationTwo independent reviewers measured patellar height on lateral radiographs, MRI, and CT scans over one month. Each reviewer was blinded to the other’s measurements and data from other imaging modalities. Measurements were taken in centimeters using the digital ruler in the PACS workstation (Simplex Bilgi Teknolojileri A.Ş., RAD-X, Version: 2.1.2, Ankara, Turkey) on lateral radiographs and mid-sagittal CT and MRI images.
For the Blackburne–Peel (BP) method (Figure 1), the length of the patellar articular surface and the perpendicular distance from its inferior margin to the medial tibial plateau were measured. A horizontal reference line was drawn through the medial tibial plateau to ensure accuracy. The BP ratio was calculated by dividing the perpendicular distance by the length of the articular surface. Standardized methodology ensured consistency across all modalities.
The study assessed two widely used patellar height indices: the Insall– Salvati and Blackburne–Peel ratios. For the Insall–Salvati method (Figure 2), patellar length was measured from the posterior superior articular margin to the most distal anterior tip, excluding osteophytes. The longest diagonal length was used. Tendon length was measured from the distal anterior patella to the tibial tuberosity. In cases of tendon laxity, a straight-line measurement was applied. The Insall– Salvati ratio was calculated as the tendon length divided by patellar length, providing a standardized assessment of patellar height.
Ethical ApprovalThis study was approved by the ethics committee of İstanbul retrospective examination of images and related records by waiving informed consent (Date: 2022-10-05, No:129).
Statistical AnalysisAll data were analyzed using SPSS software (version 22.0, SPSS Inc., Chicago, IL, USA), and statistical results were obtained. Normality of continuous variable distributions was evaluated using the Kolmogorov- Smirnov test. For the distribution of normal variables, the paired t test was used to compare between groups, and the results were expressed as mean ± standard deviation (SD). Interobserver/intermethod reliability in measurement rates was assessed using the intraclass correlation coefficient (ICC). Scores were interpreted based on the values suggested by Shrout and Fleiss;7 a score of 0 to 0.4 indicates poor reliability, a score of 0.4 to 0.75 indicates moderate reliability, and a score of more than 0.75 indicates excellent reliability. A p-value <0.05 was considered statistically significant.
Reporting GuidelinesThis study was reported in accordance with the STROBE reporting guideline.
Results
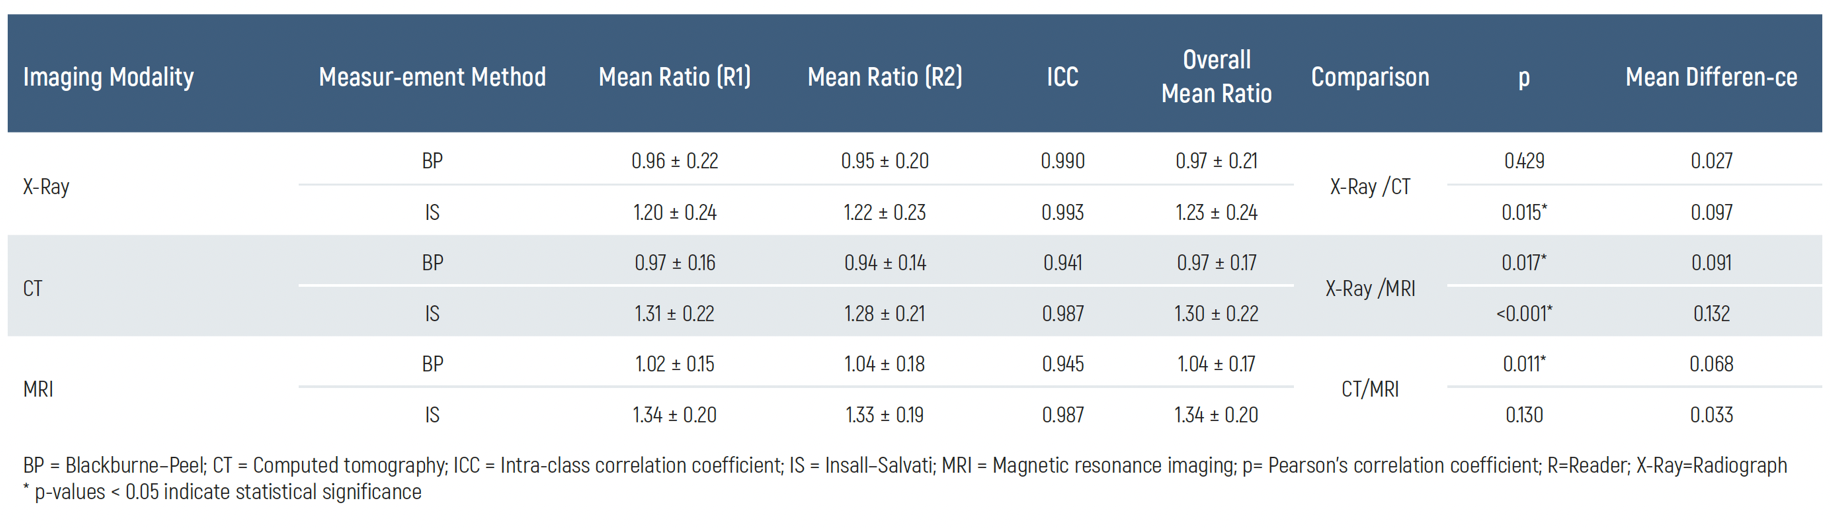
Table 1 displays the mean values obtained for the Insall–Salvati (IS) and BP methods across all imaging modalities, including radiographs, CT, and MRI. Specifically, on standard lateral radiographs, the average IS ratio was 1.20±0.26, while the BP ratio averaged 0.95±0.20. On MRI, these values were slightly higher, with the IS ratio averaging 1.34 ± 0.20 and the BP ratio at 1.02±0.15. On CT, the mean IS ratio was 1.28±0.21, and the BP ratio was 0.94±0.14, aligning closely with the radiographic measurements.
Table 1 summarizes the mean differences in patellar height ratios between the different imaging modalities. Notably, there was a statistically significant difference (p < 0.05) between radiographs and MRI for both the IS and BP methods. The mean differences observed between radiographs and MRI were 0.133 for the IS ratio and 0.091 for the BP ratio, indicating that MRI tends to yield slightly higher values than radiography for these measurements. A statistically significant difference was also found between radiographs and CT for the IS ratio (p=0.017), with a mean difference of 0.099. However, differences in BP measurements between radiographs and CT were minimal and did not reach statistical significance (p=0.429).
Regarding measurement reliability, the inter-observer agreement was excellent across all 45 examinations that included tri-modality assessments (radiograph, CT, and MRI) for both IS and BP ratios. This was reflected in high intra-class correlation coefficients (ICC≥0.94), underscoring the consistency of measurements across different readers and imaging modalities.
Discussion
Our study revealed that to match patellar height ratios obtained on MRI with those derived from radiographs, a slight adjustment of 0.13 to the IS ratio is needed. Although Ahmad et al. previously reported a mean difference of 0.10 between radiographs and MRI for the IS measurement, they concluded that this difference was not statistically significant.8 In contrast, our findings demonstrate that this difference of 0.12 reaches statistical significance, challenging their assertion. Additionally, we observed a comparable mean difference of 0.09 between radiographs and CT for the IS ratio, which aligns with the expected consistency given that both CT and MRI can reliably depict mid-sagittal views of the knee and provide similar cross-sectional images. Hence, both CT and MRI exhibit comparable differences in IS ratios (0.09 and 0.12, respectively) relative to radiographs. The absence of a statistically significant difference between CT and MRI (p=0.120) further supports the close agreement between these two modalities and reinforces the accuracy of cross-sectional imaging. Furthermore, the mean differences between radiographs and either CT or MRI fell within two standard deviations of the overall mean. Our intra-class correlation coefficients between radiographs and MRI or CT showed moderate agreement, suggesting that while differences in patellar height measurements across modalities are relatively minor, they should still be considered when interpreting results from different imaging techniques.
In analyzing the BP ratio, our results showed no significant discrepancy between radiographic and CT-based measurements, while a slight but meaningful difference was identified between radiographs and MRI. We determined that a small adjustment of 0.08 should be applied to MRI measurements to align them with radiographic findings. Although the correlation between these modalities was only moderate (ICC=0.416), the difference remained within two standard deviations of the mean ratios for radiographs and MRI. Interestingly, this 0.08 difference was not mirrored when comparing radiographs with CT measurements, where the mean difference was minor (0.03) and not statistically relevant. Consistent with previous reports, the BP method exhibited high interobserver reproducibility, as evidenced by a strong correlation coefficient and minimal interobserver variability.5,9,10 The minor adjustments recommended for IS and BP ratios in both MRI and CT apply equally to male and female patients. Moreover, no significant gender-based differences were noted in parameters such as tendon length, patellar height, patellar articular surface, or distance to the tibial plateau for either method. Consequently, these adjustments can be universally applied to all patients presenting with knee symptoms, regardless of gender.
Our study demonstrated excellent interobserver agreement for the IS method across all imaging modalities. Notably, the reliability score for MRI reached 0.98, aligning with findings from Shabshin et al. and reinforcing the consistency of MRI-based measurements. While prior studies have indicated that the BP method tends to yield slightly higher interobserver reliability than the IS method on radiographs, likely due to the challenge of accurately identifying the patellar tendon insertion at the tibial tuberosity, our results showed identical and excellent reliability scores for both IS and BP methods when assessed with radiography.9,14,15
Our findings suggest that the results are promising for potential clinical application; however, certain limitations should be acknowledged. Notably, the patient cohort was not stratified based on clinical history indicative of patellar instability or other knee abnormalities, both of which may affect patellar height measurements. This may have contributed to variability in the observed patellar height ratios. Previous studies by Shabshin et al.,6 Ahmad et al.,8 and Ali et al.
16 have reported mean IS ratios on sagittal MRI as 1.05±0.18, 1.1±0.1, and 1.07±0.36, respectively. In our study, we observed a slightly elevated IS ratio of 1.34±0.20 on MRI, which is higher than these prior values. This discrepancy may stem from differences in study design or patient inclusion criteria, particularly when compared with Ahmad et al.’s study, which specifically excluded knees with patellar instability or extensor mechanism abnormalities. While Shabshin et al.’s cohort more closely resembled ours in terms of patient selection, they still reported lower mean MRI values for IS ratios.
A notable characteristic of our study population is the higher proportion of female patients, approximately twice that of male participants. Despite this imbalance, our analysis revealed no statistically significant gender differences in patellar parameters, including tendon length, patellar height, patellar articular surface length, or the distance to the tibial plateau, as measured by both the Insall–Salvati (IS) and Blackburne–Peel (BP) methods. Therefore, it is unlikely that the female predominance in our sample contributed to the higher mean IS ratio, although previous studies have reported a greater prevalence of patella alta and patellofemoral abnormalities in females.
Interestingly, our study also reported a mean patellar tendon length on MRI of 4.25±0.70 cm, which is higher than that documented by Shabshin et al.6 This finding may reflect the incidental higher prevalence of patella alta in our study cohort, although it may also be influenced by demographic or measurement factors. Despite the absence of categorization based on clinical history, and even though we noted higher patellar height averages than some previous studies, the mean patellar tendon length we obtained aligns with the normal ranges reported for post-mortem knees and control groups in studies by Neyret et al.3,17,18
Our findings were highly consistent with those reported by Lee et al.13 The slight quantitative discrepancies observed between our results and those of Lee et al. were likely attributable to differences in sample age distributions, participant numbers, and potential racial variations among the studied populations.
Limitations
Despite some limitations in our study, the patient population examined reflects the typical clinical cohort that commonly presents with patellofemoral complaints. Therefore, our findings may be relevant to daily practice, although future studies with larger and more diverse patient groups could help validate and further generalize these results.
Conclusion
When interpreting patellar height using the Insall–Salvati (IS) and Blackburne–Peel (BP) ratios across radiographs, CT, and MRI, it is essential to apply a correction factor ranging from 0.08 to 0.12 to ensure consistency of measurements across these modalities. Recognizing these subtle yet important adjustments is crucial for clinicians to accurately assess patellar position and make informed decisions regarding patient management. Failure to account for these differences may lead to misinterpretation, potentially affecting clinical outcomesNotably, our study demonstrated excellent interobserver agreement for measurements performed across all three imaging modalities, further supporting the reliability of these methods when appropriate correction factors are applied.
Declarations
Ethics Declarations
The authors confirm that all procedures performed in this study complied with the ethical standards of the institutional research committee and with the 1964 Declaration of Helsinki and its later amendments.
Animal and Human Rights Statement
All procedures performed in this study were in accordance with the ethical standards of the institutional and/or national research committee and with the 1964 Helsinki Declaration and its later amendments or compareable ethical standards.
Informed Consent
Due to the retrospective nature of the study and the use of anonymized imaging data, the requirement for informed consent was waived by the ethics committee.
Data Availability
The datasets generated and analyzed during the current study are available from the corresponding author upon reasonable request.
Conflict of Interest
The authors declare that there is no conflict of interest.
Funding
None
Scientific Responsibility Statement
The authors declare that they are responsible for the article’s scientific content including study design, data collection, analysis and interpretation, writing, some of the main line, or all of the preparation and scientific review of the contents and approval of the final version of the article.
Abbreviations
BP: Blackburne–Peel
CT: Computed Tomography
ICC: Intraclass Correlation Coefficient
IS: Insall–Salvati
MRI: Magnetic Resonance Imaging
PACS: Picture Archiving and Communication System
SD: Standard Deviation
References
-
Biedert RM. Patella Alta: When to correct and impact on other anatomic risk factors for patellofemoral instability. Clin Sports Med. 2022;41(1):65-76.
-
Kwak YH, Park SS, Huser AJ, et al. Reliability and modality analysis of patellar height measurement in pediatric knee. Front Pediatr. 2024;12(3):1323015.
-
Neyret P, Robinson AH, Le Coultre B, Lapra C, Chambat P. Patellar tendon length—the factor in patellar instability? Knee. 2002;9(1):3-6.
-
Diederichs G, Issever AS, Scheffler S. MR imaging of patellar instability: injury patterns and assessment of risk factors. Radiographics. 2010;30(4):961-981.
-
Phillips CL, Silver DA, Schranz PJ, Mandalia V. The measurement of patellar height: a review of the methods of imaging. J Bone Joint Surg Br. 2010;92(8):1045-1053.
-
Shabshin N, Schweitzer ME, Morrison WB, Parker L. MRI criteria for patella alta and baja. Skeletal Radiol. 2004;33(8):445-450.
-
Rousson V. Assessing inter-rater reliability when the raters are fixed: Two concepts and two estimates. Biom J. 2011;53(3):477-490.
-
Ahmad M, Janardhan S, Amerasekera S, Nightingale P, Ashraf T, Choudhary S. Reliability of patellotrochlear index in patellar height assessment on MRI-correction for variation due to change in knee flexion. Skeletal Radiol. 2019;48(3):387-393.
-
van Duijvenbode D, Stavenuiter M, Burger B, van Dijke C, Spermon J, Hoozemans M. The reliability of four widely used patellar height ratios. Int Orthop. 2016;40(3):493-497
-
Geraghty L, Humphries D, Fitzpatrick J. Assessment of the reliability and validity of imaging measurements for patellofemoral instability: an updated systematic review. Skeletal Radiol. 2022;51(12):2245-22456.
-
Lum ZC, Saiz AM, Pereira GC, Meehan JP. Patella baja in total knee arthroplasty. J Am Acad Orthop Surg. 2020;28(8):316-323.
-
Verhulst FV, van Sambeeck JDP, Olthuis GS, van der Ree J, Koëter S. Patellar height measurements: Insall-Salvati ratio is most reliable method. Knee Surg Sports Traumatol Arthrosc. 2020;28(3):869-875.
-
Lee PP, Chalian M, Carrino JA, Eng J, Chhabra A. Multimodality correlations of patellar height measurement on X-ray, CT, and MRI. Skeletal Radiol. 2012;41(10):1309-1314.
-
Han H, Zhang X. A new method for evaluation of patellar height and the position of the joint line before and after total knee arthroplasty. BMC Musculoskelet Disord. 2020;21(1):768
-
Igoumenou VG, Dimopoulos L, Mavrogenis AF. Patellar height assessment methods: An update. JBJS Rev. 2019;7(1):e4.
-
Ali SA, Helmer R, Terk MR. Patella alta: lack of correlation between patellotrochlear cartilage congruence and commonly used patellar height ratios. AJR Am J Roentgenol. 2009;193(5):1361-1366.
-
Akaoka Y, Iseki T, Kanto R, et al. Changes in patellar height and patellofemoral alignment following double level osteotomy performed for osteoarthritic knees with severe varus deformity. Asia Pac J Sports Med Arthrosc Rehabil Technol. 2020;22(4):20-6.
-
Tanaka MJ. The Anatomy of the Medial Patellofemoral Complex. Sports Med Arthrosc Rev. 2017;25(2):e8-e11.
Figures
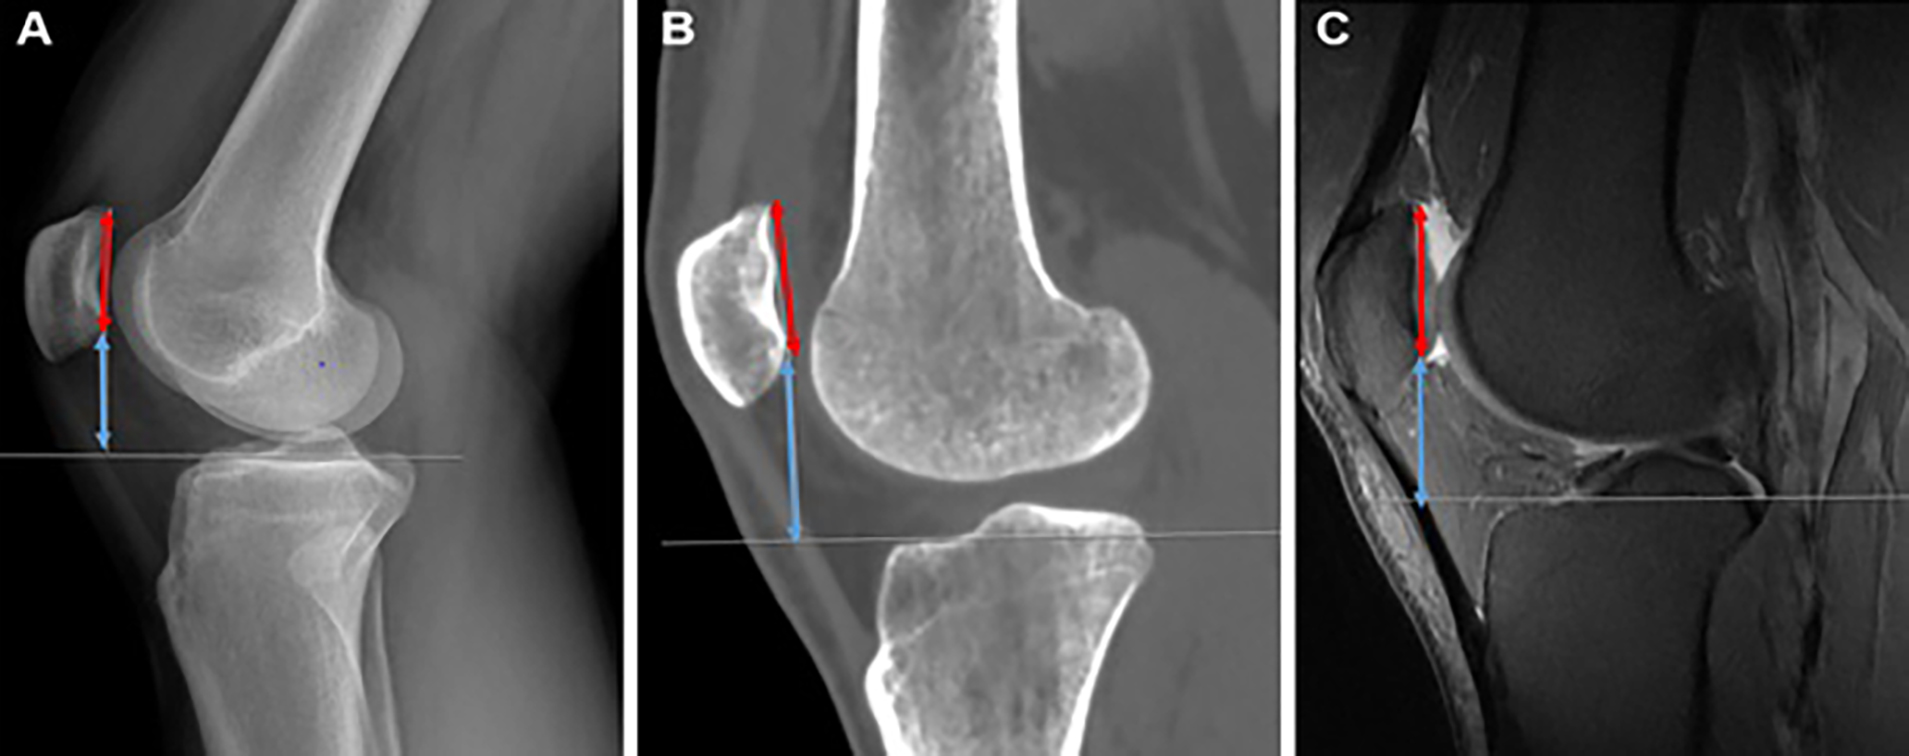
Figure 1. BP = Blackburne–Peel; CT = Computed tomography; MRI = Magnetic resonance imaging; X-Ray=Radiograph. A. Lateral knee X-Ray illustrating the BP method, where the length of the patellar articular surface (red line with arrows on both ends) is measured. In this patient, the tibial plateau appears at a slight inclination relative to the viewer, so a horizontal line is drawn through the tibial plateau to facilitate the visualization of the perpendicular distance (thin white line) from the inferior edge of the patellar articular surface to the tibial plateau surface (blue line with arrows on both ends), B. CT on the bone window showing the BP measurements. The perpendicular distance (thin white line) from the inferior tip of the patellar articular margin to the medial tibial plateau is demonstrated (blue line with arrows on both ends). The patellar articular surface (red line with arrows on both ends) is displayed in this mid-sagittal view, C. Sagittal fat-saturated protondensity MRI demonstrating the measurements of the patellar articular surface (red line with arrows on both ends) and the perpendicular distance (blue line with arrows on both ends) from its inferior edge to the medial tibial plateau surface
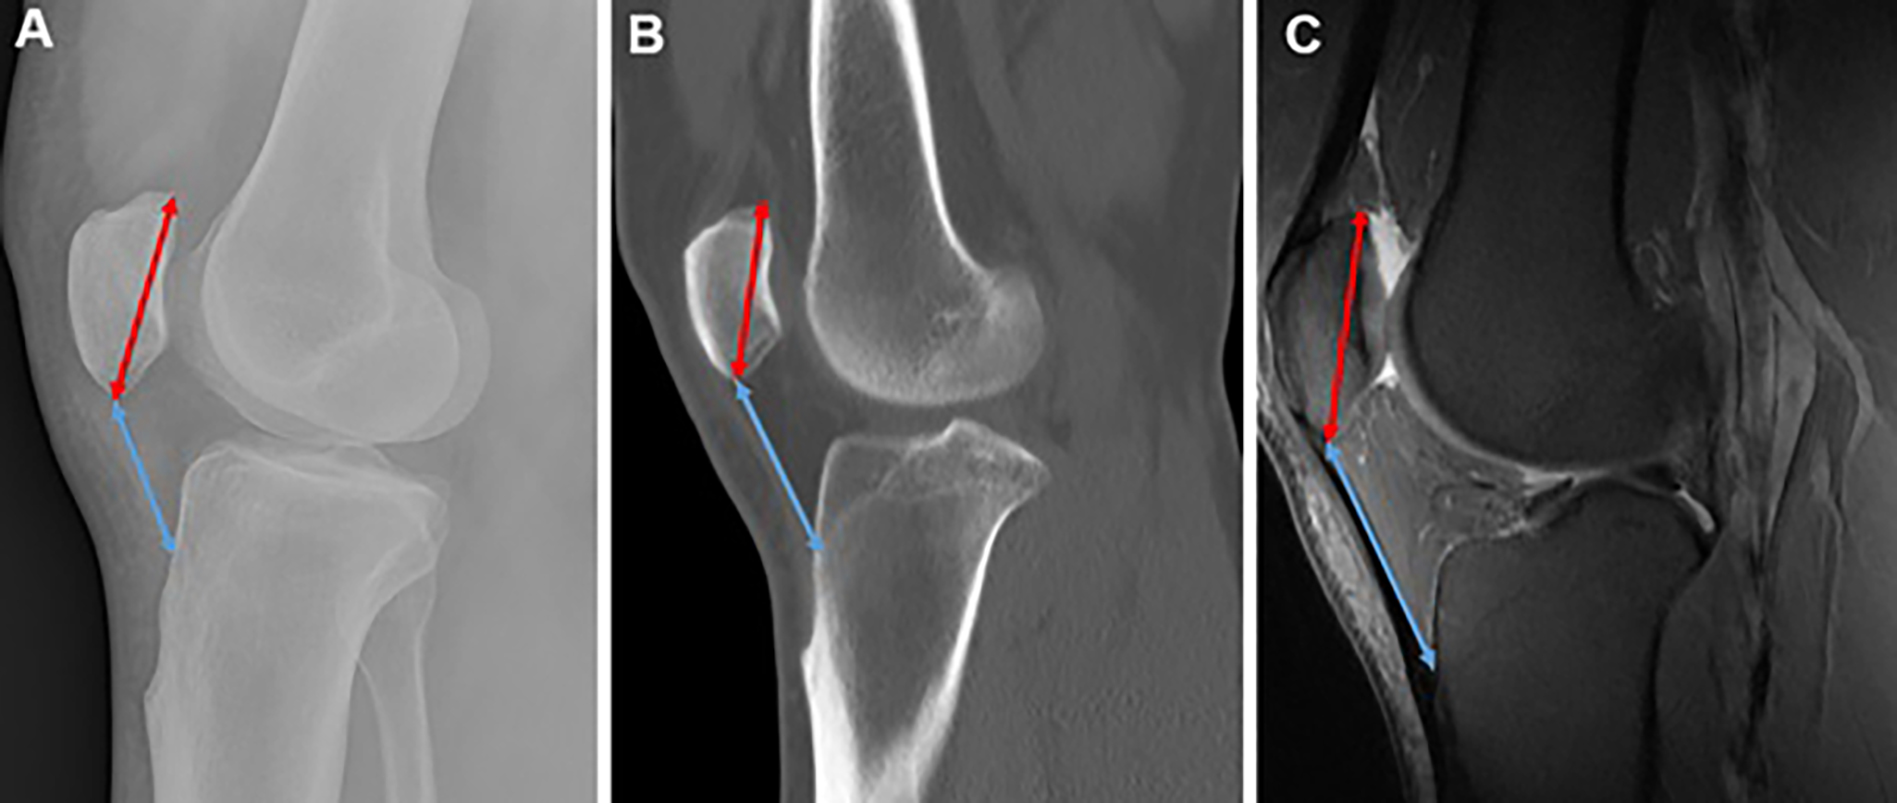
Figure 2. CT = Computed tomography; IS = Insall–Salvati; MRI = Magnetic resonance imaging; X-Ray=Radiograph. A. Lateral radiograph depicting the IS measurements. The patellar length (red line with arrows at both ends) is measured from the tip of the posterior articular margin to the distal anterior tip of the patella. The patellar tendon length (blue line with arrows at both ends) is obtained by measuring from the distal anterior tip of the patella to its insertion on the tibial tuberosity, where the tibial tuberosity is most prominent, B. CT on the bone window illustrating the IS measurements. Although the patellar tendon appears slightly curved near the tibial insertion, the straight-line distance from the patellar attachment to the tibial tuberosity insertion is utilized (blue line with arrows at both ends). The patellar length is also indicated (red line with arrows at both ends), C. Sagittal fat-saturated proton-density MRI demonstrating the measurements of the patellar length (red line with arrows at both ends) and the patellar tendon length (blue line with arrows at both ends) according to the IS method
Tables
Table 1. Inter-observer agreement, mean values, and mean differences of patellar height ratios across imaging modalities
Additional Information
Publisher’s Note
Bayrakol MP remains neutral with regard to jurisdictional and institutional claims.
Rights and Permissions

This work is licensed under a Creative Commons Attribution-NonCommercial 4.0 International License (CC BY-NC 4.0). To view a copy of the license, visit https://creativecommons.org/licenses/by-nc/4.0/
About This Article
How to Cite This Article
Levent Karakaş, Tuna Demirbaş. Comparison of patellar height measurements using three different imaging modalities. Eu Clin Anal Med 2025;13(3):56-60
- Received:
- June 12, 2025
- Accepted:
- August 4, 2025
- Published Online:
- August 31, 2025
- Printed:
- September 1, 2025