Abstract
Aim This study aimed to evaluate the concentrations of plasma pentraxin-3 (PTX-3), growth differentiation factor-15 (GDF-15), interleukin-6 (IL-6), and tumor necrosis factor-α (TNF-α) before and after national and international competitions, which represent physically and psychologically intense exercises for elite and young male cyclists, who are endurance athletes. Methods Eight young male and eight elite male cyclists participated in the study, conducted during two national and international races. The first race covered 116.4 km, and the second covered 122.5 km. Blood samples were collected before the competition, immediately after the race, and 1 hour and 3 hours post-race. The levels of PTX-3, GDF-15, IL-6, and TNF-α in the samples were analyzed using the ELISA method. Results The PTX-3 level in elite athletes was lower 3 hours after the competition compared to 1 hour after the race (p<0.05). GDF-15 levels in elite athletes were higher 1 and 3 hours after the race compared to before and immediately after the competition but decreased 3 hours after the competition (p<0.05). In young athletes, GDF-15 levels were higher immediately after, as well as 1 and 3 hours post-race, compared to pre-competition levels (p<0.05). IL-6 levels in both young and elite athletes were higher immediately after and 1 hour post-race, compared to pre-competition levels (p<0.05). No significant changes were observed in TNF-α levels (p>0.05).In conclusion, in professional road cyclists, significant changes in GDF-15 and IL-6 levels were observed in response to competition, while PTX-3 and TNF-α levels remained unchanged. Conclusion To determine the causes and sources of the change in these markers, more detailed molecular-level studies are needed, especially with experimental animals.Keywords
Introduction
The pentraxin superfamily is divided into two subfamilies: short and long pentraxins. C-reactive protein (CRP) and serum amyloid P (SAP) form the short pentraxin branch of the family. The normal plasma concentration of PTX-3 is 0.25–3 ng/ml. CRP and SAP indicate the systemic response to local inflammation by being produced and released in hepatic hepatocytes, while PTX-3 indicates the inflammatory state of the vascular structure as it is released directly from the damaged tissue. PTX-3 expression increases during inflammation, and circulating levels of PTX-3 rise in various pathological conditions affecting the cardiovascular system, including vasculitis, acute myocardial infarction (MI), rheumatoid arthritis, and systemic inflammatory response syndrome/septic shock. Serum levels begin to rise immediately after the onset of inflammation, reaching a maximum value within approximately 7.5 hours, and return to normal within 3–5 days. PTX-3 levels in the blood can increase dramatically from less than two ng/ml to 200–800 ng/ml during inflammatory conditions and active disease. This increase occurs much faster than the rise in CRP levels, making PTX-3 a useful early marker of inflammation.1
PTX3 plays a role in the progression of cardiovascular diseases (CVD) through mechanisms such as exacerbating vascular endothelial dysfunction, affecting angiogenesis, and regulating inflammation and oxidative stress. For this reason, PTX-3 can be used as an early marker of inflammation.1 Clinically, PTX3 shows a positive correlation with arterial hypertension, current-mediated dilatation, and intima- media thickness. Therefore, the role of PTX3 in the pathogenesis and evaluation of endothelial dysfunction is obvious, and it may become a biomarker in this direction.2
Growth differentiation factor-15 (GDF-15) belongs to the transforming growth factor-beta (TGF-β) superfamily and acts as a hormone or a stress-sensitive circulating factor. GDF-15 is a protein with a molecular weight of 25 kDa. Its physiological concentration in humans is approximately 450 pg/ml. Circulating concentrations of GDF-15 have been shown to increase in various pathological conditions, such as metabolic diseases, inflammation, heart failure, and cardiac hypertrophy. GDF-15 production increases in response to various stimuli, including oxidized low-density lipoprotein (ox-LDL) cytokines such as IL-1β, TNF-α, angiotensin II, TGF-β, and M-CSF. GDF-15 appears to act as an anti-inflammatory factor by inhibiting macrophage activation. Its expression is induced by mitochondrial dysfunction following an increase in reactive oxygen species (ROS), which accelerates aging by damaging essential macromolecules such as DNA, proteins, and lipids. Higher plasma GDF-15 concentrations have been reported in individuals with Down syndrome, who exhibit accelerated aging compared to healthy controls of similar age. As a circulating myokine, GDF-15 increases in response to muscle-specific mitochondrial stress and muscle dysfunction in humans and various mouse models. Increased GDF-15 production appears to allow muscle regeneration and remodeling. Following mitochondrial stress, increased GDF-15 expression in skeletal muscle regulates systemic metabolic homeostasis, increases insulin resistance, and affects lipolysis and oxidative metabolism in the liver, muscle, and white adipose tissues, thereby protecting against diet induced obesity.3 GDF-15 plays a protective role similar to neuroglia in the central nervous system (CNS), supporting the survival of dopaminergic neurons and spinal cord motor neurons. GDF-15 is also expressed in adipose tissue and secreted by adipocytes. GDF-15 levels positively correlate with adiponectin levels and negatively correlate with body mass index (BMI) and body fat mass. Obese individuals have increased plasma GDF-15 concentrations, with the highest GDF-15 levels observed in patients with type 2 diabetes.4General Characteristics of Bicycle Tour RacesTour races are divided into three main branches: mountain bike, road bike, and track (against time) bike. Physiological changes that occur in tour races began to be measured scientifically in the early 1990s with the use of heart rate monitors. The most common and frequently used method is the measurements made during each stage and run of different intensities during the race. Usually, identical phases are created with the heart rates (HR) detected during the previously performed ergometric tests. Measurements made under laboratory conditions or during the race have shown that HR and power output (W) are related, and it has been shown that the value of W can be calculated from HR measurements. With this method, the physiological load (TRIMP) produced during the race is calculated and recorded.Pentraxin-3 and ExerciseAcute aerobic exercise increases systemic PTX-3 concentrations.5 Plasma PTX-3 concentrations have been reported to increase for up to 1 hour in response to a single aerobic exercise session. Resting PTX-3 concentrations increase in aerobically active people compared to sedentary men, and cardiorespiratory fitness levels (VO2max) predict acute exercise-induced PTX-3 response following submaximal and maximal levels of aerobic exercise. Plasma PTX-3 concentrations increased after 8 weeks of habitual moderate aerobic exercise training in elderly men and women, and these increases were associated with increased VO2max and improved cardiovascular function indices.6 It has been shown that the capacity of acute exercise to increase plasma PTX-3 concentrations is similar in normal-weight individuals and obese individuals. This suggests that a single aerobic exercise session is equally beneficial for obese and normal-weight individuals.7 Also, in response to 12 weeks of aerobic exercise training, high resting PTX-3 concentrations have been associated with a decrease in BMI in obese and overweight women. From these results, it may be thought that increased PTX-3 concentrations may also mediate the anti- inflammatory effects of aerobic exercise in obese individuals.Growth Differentiation Factor-15 and ExerciseThe role of GDF-15 in regulating energy balance has started to attract attention with the demonstration that GDF-15 suppresses food intake.8 Pharmacological and genetic studies have confirmed that GDF-15 administration reduces body weight largely by reducing appetite. Some studies have also suggested that GDF-15 can directly increase thermogenesis and improve insulin sensitivity.4 GDF-15 is expressed in many tissues, including skeletal November muscle, and its release is usually increased in response to cellular stress or injury. GDF-15 expression in mouse skeletal November muscle is markedly increased in response to mitochondrial stress. Circulating GDF-15 levels are elevated in patients with muscle atrophy and mitochondrial myopathy. These November Tues indicate that GDF-15 may be released into the circulation from skeletal muscle in response to a stress stimulus.9The Effect of Exercise on IL-6 and TNF-α LevelsInitially, IL-6 was described as a pro-inflammatory cytokine.10 Subsequently, the anti-inflammatory properties of IL-6 have also been identified.IL-6 is secreted from monocytes, macrophages, fibroblasts, and vascular endothelial cells. When released from macrophages, it shows a pro-inflammatory effect by following the NF-кB signaling pathway. When IL-6 is released from skeletal muscle, it exerts anti- inflammatory action by following the Ca/NFAT and MAPK pathways. An increase in IL-6 levels due to exercise has a suppressive effect on inflammation. An increase in the level of IL-6 due to the secretion of macrophages has an effect that triggers systemic inflammation.11-12
Materials and Methods
Participant SelectionThe study was conducted with two groups of cyclists from the TorkuŞekerspor Cycling Team. The first group consisted of elite male cyclists aged 20–36, and the second group consisted of young male cyclists aged 17–18.
Before the study began, athletes were informed about the study, and they signed an informed consent form. All participants had a body mass index (BMI) below 25. None of the participants had any acute or chronic illnesses, and none had smoking or alcohol consumption habits. Additionally, no participants were using anti-inflammatory or steroid-like medications.
For inclusion in the study, athletes in the first group were required to have participated in a training program for at least two years, with three training sessions per week lasting an average of 2 hours each day at an intensity of 15–16 on the Borg scale. For athletes in the second group, the same criteria applied, but for a minimum of one year. Participants who did not meet these training requirements were excluded from the study.
This study was conducted during two different races.
1. The first race was the 116.4 km International Mevlana Cycling Tour, a stage race in Konya. Blood samples were collected from the eight elite male cyclists (Group 1) before the competition, immediately after the race, and 1 and 3 hours post-race.
2. The second race was the 122.5 km National Individual Classification Konya Stage, organized by the Turkish Cycling Federation. Blood samples were collected from the eight young male cyclists (Group 2) before the competition, immediately after the race, and 1 and 3 hours post-race.Anthropometric MeasurementsBefore the study began, anthropometric measurements of the athletes were taken. Height was measured in centimeters (cm) using a stadiometer while the athletes stood in an anatomical position, wearing sports clothing but no shoes. Body weight was measured in kilograms (kg) using a digital scale. The body mass index (BMI) was calculated using the formula BMI = weight (kg) / height (m²).Laboratory AnalysesAnalysis of PTX-3 LevelsPlasma PTX-3 levels were measured using a commercially available ELISA kit (Catalog No: MBS772804, MyBioSource ELISA Kits, USA), following the protocol provided with the kit. This kit was a ready-to- use solid-phase enzyme-linked immunosorbent assay (ELISA) kit that worked based on the sandwich principle. PTX-3 levels were expressed as ng/ml. For this kit, the intra-assay coefficient of variation (CV) was less than 10%, the inter-assay CV was less than 15%, and the minimum detection limit was 0.1 ng/ml.Analysis of GDF-15 LevelsPlasma GDF-15 levels were analyzed using an Invitrogen ELISA kit (Catalog No: BMS2258, Vienna, Austria). Analyses were performed according to the instructions provided with the kit. GDF-15 levels were expressed as pg/ml. For this kit, the intra-assay CV was 4.2%, the inter- assay CV was 2.9%, and the minimum detection limit was 0.589 pg/ml.Analysis of IL-6 LevelsPlasma IL-6 levels were analyzed using an Invitrogen ELISA kit (Catalog No: BMS213-2, Vienna, Austria), following the kit’s instructions. IL-6 levels were expressed as pg/ml. The intra-assay CV was 3.4%, the inter-assay CV was 5.2%, and the minimum detection limit was 0.92 pg/ml.
Analysis of TNF-α Levels
Plasma TNF-α levels were analyzed using an eBioscience ELISA kit (Catalog No: BMS223-4, Vienna, Austria). Before analysis, all reagents and samples were brought to room temperature. TNF-α levels were expressed as pg/ml. For this kit, the intra-assay CV was 6.0%, the inter- assay CV was 7.4%, and the minimum detection limit was 2.3 pg/ml.Ethical Approval This study was approved by the Ethics Committee of Non-Interventional Clinical Trials (Date: 08.03.2017, Decision No: 2017/05).Statistical AnalysisThe data obtained from the study were analyzed using SPSS 16.0 for Windows (Chicago, IL, USA). Comparisons were made between the elite cyclist group (Group 1) and the young cyclist group (Group 2), as well as within the groups themselves. Data were presented as mean ± standard deviation. The normality of the data was tested using the Shapiro-Wilk test. The Mann-Whitney U test was used for comparisons between groups and repeated-measures ANOVA was used for within- group comparisons. p<0.05 was considered statistically significant.Reporting GuidelinesThis study was conducted and reported in accordance with the STROBE guidelines.
Results
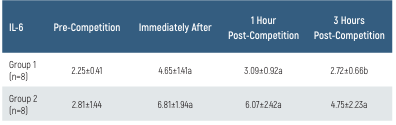
Demographic characteristics of the groups: the age of the 2nd group is lower than the 1st group (p<0.05). There was no difference in height, weight, and BMI (p>0.05). The PTX-3 values and their time-dependent changes for the groups are presented in Table 1 and Figure 1. In Group 1, the PTX-3 value at 3 hours post-race was lower than at 1-hour post-race (p<0.05). There was no difference in PTX-3 levels between the groups (p>0.05). The GDF-15 values and their time-dependent changes for the groups are presented in Table 2 and Figure 2. In Group 1, GDF-15 levels at 1 and 3 hours post-race were higher than pre-race and immediately post-race levels, while the GDF-15 level at 3 hours post-race was lower than at 1-hour post-race (p<0.05). In Group 2, GDF-15 levels immediately after and at 1 and 3 hours post-race were higher than pre-race levels (p<0.05). There was no difference in GDF-15 levels between the groups (p>0.05). The IL-6 values and their time-dependent changes for the groups are presented in Table 3 and Figure 3. In Group 1, IL-6 levels immediately post-race and 1-hour post-race were higher than pre-race levels (p<0.05). The IL-6 level at 3 hours post-race was lower than immediately post-race levels (p<0.05). In Group 2, IL-6 levels were higher immediately after and 1 and 3 hours post-race, compared to pre-race levels (p<0.05). There was no difference in IL-6 levels between the groups (p>0.05). There were no differences in TNF-α levels in terms of time or between the groups (p>0.05).Discussion
The effects of exercise on PTX-3 levels have been of interest in recent years. However, in our study, the lack of difference in PTX-3 levels between the elite and young groups may be attributed to the similar fitness levels of both groups. The literature on the response of PTX-3 to acute exercise is limited. In one study, it was reported that 50% of VO2max in athletes had a 2-fold increase in PTX-3 levels during 3-hour cycling exercise,5-6 the increase continued 6 hours after exercise, and returned to rest value 24 hours later. In the elderly, PTX-3 expression and PTX-3/TLR-4 ratios have been shown to decrease in PBMC regardless of oxidative stress response after regular aerobic exercise.6 These findings suggest that PTX-3 levels are influenced by factors such as exercise intensity, duration, and the athlete’s fitness level.
In our study, plasma GDF-15 levels were not different between elite and young cyclists. Additionally, plasma GDF-15 levels increased 1 and 3 hours post-competition compared to pre-race and immediately post-race levels in elite cyclists, while the levels decreased at 3 hours post-race compared to 1 hour post-race. In young athletes, GDF-15 levels increased at all time points after the competition compared to pre-race levels. Increased circulating GDF-15 levels have been reported after ultramarathon races.13 However, in another study, no significant increase in GDF-15 levels was observed after a football match.14 Researchers in a study with rugby players measured GDF-15 levels before and after the season and found an increase in GDF-15 levels at the end of the season.15 In another study involving seven healthy men during 60 minutes of submaximal exercise, a significant increase in GDF-15 levels was detected after exercise compared to pre-exercise levels.9 These data show that GDF-15 is associated with decreased muscle performance and increased inflammation.3,8 In a study with obese individuals, a 12-week aerobic exercise and diet intervention resulted in both a reduction in body fat mass and an increase in plasma GDF-15 levels.16
During resistance exercises, when the intensity is high and the duration is long, excessive muscle workload and fatigue lead to pain and damage in the muscles. Plasma proteins and leukocytes migrate to the damaged area and metabolically active tissues to initiate the inflammatory response. Interferons, along with cytokines (TNF-α, IL-1α/β, IL-6), help regulate inflammation.17 Cytokines can exhibit pro-inflammatory and anti-inflammatory effects to maintain homeostasis. IL-6 plays a role in repairing muscle damage caused by exercise by promoting the proliferation of satellite cells and the formation of new myocytes.11 Circulating IL-6 levels can increase up to 100-fold in response to acute exercise.10 In a study involving eight cyclists in a four-stage cycling race, TNF-α levels increased 27-fold and IL-6 levels increased 14-fold at 3 hours post-race.12 One study reported that 24 weeks of resistance exercise caused a significant increase in plasma TNF-α and IL-6 levels.18 In a study with fibromyalgia patients, resistance exercises were shown to decrease plasma TNF-α levels while increasing plasma IL-6 and IL-8 levels.19 An increase in plasma IL-6 levels was detected in subjects who underwent intensive cardiorespiratory exercise.20
In summary, the goal of our study with professional road cyclists was to determine the changes in the biomarkers PTX-3, GDF-15, IL-6, and TNF-α before and after intense exercise.
Limitations
The data used in this study belong to a single center and the generalizability of the results is limited. Since the number of patients in the study is relatively low, the applicability of the findings to broader populations is limited.
The short follow-up period caused limitations in the evaluation of long-term outcomes.
Conclusion
In conclusion, the findings of this study show that significant changes in GDF-15 and IL-6 levels occur in response to competition in professional road cyclists, and these changes are more pronounced in elite cyclists compared to young cyclists. However, more detailed molecular-level studies, especially those involving animal models, are needed to determine the causes and sources of these changes in these biomarkers.
Declarations
Ethics Declarations
The authors declare that all procedures performed in this study were conducted in accordance with institutional, national, and international ethical standards.
Informed Consent
Written informed consent was obtained from all participants prior to their inclusion in the study.
Data Availability
The datasets generated and analyzed during the current study are available from the corresponding author upon reasonable request.
Conflict of Interest
The authors declare no conflicts of interest.
Funding
Scientific Research Project contribution was received from Selçuk University Institute of Health Sciences.
Author Contributions (CRediT Taxonomy)
Conceptualization: A.K., M.B.
Methodology: A.K.
Formal Analysis: A.K.
Investigation: A.K.
Data Curation: A.K.
Writing – Original Draft: A.K.
Writing – Review & Editing: M.B.
Supervision: M.B.
Abbreviations
BMI: Body mass index
CRP: C-reactive protein
CVD: Cardiovascular disease
ELISA: Enzyme-linked immunosorbent assay
GDF-15: Growth differentiation factor-15
IL-6: Interleukin-6
PTX-3: Pentraxin-3
ROS: Reactive oxygen species
SAP: Serum amyloid P
TNF-α: Tumor necrosis factor-alpha
TRIMP: Training impulse
VO2max: Maximal oxygen consumption
References
- Ye X, Wang Z, Lei W, Shen M, Tang J, Xu X, et al. Pentraxin3: A promising therapeutic target for cardiovascular diseases. Ageing Res Rev. 2024;93:102163. doi:10.1016/j.arr.2023.102163
- Zlibut A, Bocsan IC, Agoston-Coldea L. Pentraxin-3 and endothelial dysfunction. Adv Clin Chem. 2019;91:163-179. doi:10.1016/bs.acc.2019.03.005
- Ost M, Igual GC, Coleman V, Keipert S, Efstathiou S, Vidic Vandothers. Muscle-derived GDF15 drives diurnal anorexia and systemic metabolic remodeling during mitochondrial stress. EMBO reports. 2020;21(3):E48804. doi:10.15252/embr.201948804
- Lee SE, Kang SG, Choi MJ, Jung SB, Ryu MJ, Chung HK, et al. Growth differentiation factor 15 mediates systemic glucose regulatory action. Diabetes. 2017;66(11):2774-2788. doi:10.2337/db17-0333
- Slusher AL, Huang CJ. Association of pentraxin 3 with insulin resistance and glucose response following maximal aerobic exercise. Can J Physiol Pharmacol. 2016;94(7):734-738. doi:10.1139/cjpp-2015-0464
- Estébanez B, Rodriguez AL, Visavadiya NP, Whitehurst M, Cuevas MJ, González-Gallego J, et al. Aerobic training and pentraxin 3. Antioxidants. 2020;9(2):110.
- Slusher AL, Mock JT, Whitehurst M, Maharaj A, Huang CJ. Impact of obesity on pentraxin 3 response to exercise. Metabolism. 2015;64(2):323-329. doi:10.1016/j.metabol.2014.10.022
- Chung HK, Ryu D, Kim KS, Chang JY, Kim YK, Yi HS, et al. GDF15 is a myomitokine regulating energy homeostasis. J Cell Biol. 2017;216(1):149–165.
- Kleinert M, Clemmensen C, Sjoberg KA, Carl CS, Jeppesen JF, Wojtaszewski JFP, et al. Exercise increases circulating GDF15 in humans. Mol Metab. 2018;9:187-191. doi:10.1016/j.molmet.2017.12.016
- Kristiansen OP, Mandrup-Poulsen T. Interleukin-6 and diabetes. Diabetes. 2005;54(2):114-124. doi:10.2337/diabetes.54.suppl_2.s114
- Belizário JE, Fontes-Oliveira CC, Borges JP, Kashiabara JA, Vannier E. IL-6 in skeletal muscle. Springerplus. 2016;5:619.
- Martinez AC, Pons MM, Gomila AS, Mari JAT, Biescas AP. Cytokine changes in elite cyclists. Clin Physiol Funct Imaging. 2015;35(5):351-358.
- Tchou I, Margeli A, Tsironi M, Skenderi K, Barnet M, Kanaka-Gantenbein C, et al. Growth-differentiation factor-15 induction in ultramarathon athletes. Biomarkers. 2009;14(6):418-422.
- Sanchis-Gomar F, Bonaguri C, Aloe R, Pareja-Galeano H, Martinez-Bello V, Gomez-Cabrera MC, et al. Effects of acute exercise on cardiovascular biomarkers. Transl Res. 2013;162(2):102-109. doi:10.1016/j.trsl.2013.02.006
- Galliera E, Lombardi G, Marazzi M, Grasso D, Vianello E, Pozzoni R, et al. Exercise and circulating biomarkers in rugby players. Scand J Clin Lab Invest. 2014;74(6):492-499. doi:10.3109/00365513.2014.905697
- Zhang H, Fealy CE, Kirwan JP. Exercise training promotes GDF15-associated fat loss. Am J Physiol Endocrinol Metab. 2019;316(5):E829-E836. doi:10.1152/ajpendo.00439.2018
- Van Diepen JA, Berbee JF, Havekes LM, Rensen PC. Inflammation and lipid metabolism. Atherosclerosis. 2013;228(2):306-315.
- Hangelbroek RWJ, Knuiman P, Tieland M, De Groot LCPGM. Resistance exercise and inflammation. Exp Gerontol. 2018;106:154-158.
- Ernberg M, Christidis N, Ghafouri B, Bileviciute-Ljungar I, Löfgren M, Larsson A, et al. Resistance exercise in fibromyalgia. Arthritis Res Ther. 2016;18(1):137.
- Windsor MT, Bailey TG, Perissiou M, Greaves K, Jha P, Leicht AS, et al. Acute inflammatory responses to exercise. Med Sci Sports Exerc. 2018;50(4):649-658. doi:10.1249/mss.0000000000001501
Tables
Table 1. PTX-3 levels of the groups and time-dependent changes
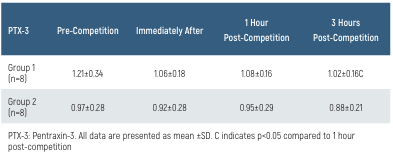
Table 2. GDF-15 levels of the groups and time-dependent changes
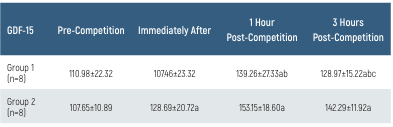
Table 3. IL-6 levels of the groups and time-dependent changes
Figures
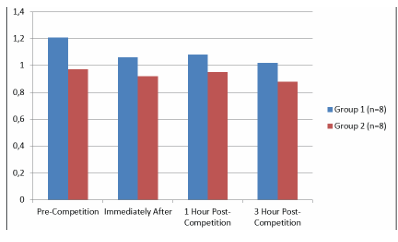
Figure 1. PTX-3 levels of the groups and time-dependent changes
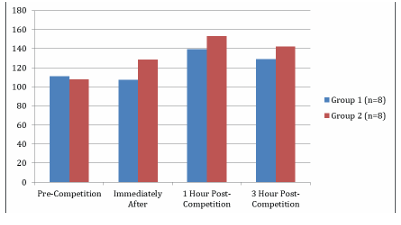
Figure 2. GDF-15 levels of the groups and time-dependent changes
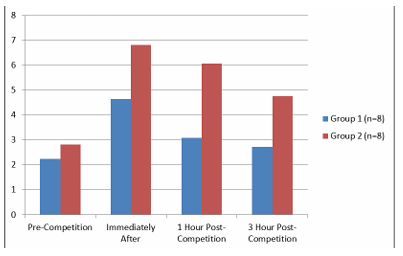
Figure 3. IL-6 levels of the groups and time-dependent changes
Additional Information
Publisher’s Note
Bayrakol MP remains neutral with regard to jurisdictional and institutional claims.
Rights and Permissions
This work is licensed under a Creative Commons Attribution-NonCommercial 4.0 International License (CC BY-NC 4.0). To view a copy of the license, visit https://creativecommons.org/licenses/by-nc/4.0/
About This Article
How to Cite This Article
Alpaslan Kisinma, Muaz Belviranli. Plasma pentraxin-3 and growth differentiation factor-15 response to acute aerobic exercise in professional road cyclists. Eu Clin Anal Med 2025;13(1):10-14. doi:10.4328/ECAM.10105
- Received:
- 04.10.2024
- Accepted:
- 17.12.2024
- Published Online:
- 30.12.2024
- Printed:
- 01.01.2025